Long-wave Runup: Difference between revisions
| Line 35: | Line 35: | ||
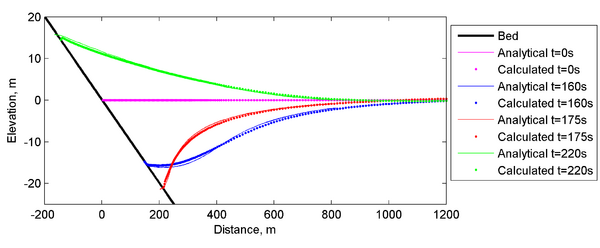
Figure 2 shows a comparison of computed and analytical water surface elevations near the shoreline at 4 different time steps. | Figure 2 shows a comparison of computed and analytical water surface elevations near the shoreline at 4 different time steps. | ||
[[Image:Long-wave_Runup_Water_Level.png|thumb|none|600px| Figure 2. Comparison of calculated and analytical water levels for different time steps. ]] | [[Image:Long-wave_Runup_Water_Level.png|thumb|none|600px| Figure 2. Comparison of calculated and analytical water levels for different time steps. ]] | ||
<br style="clear:both" /> | |||
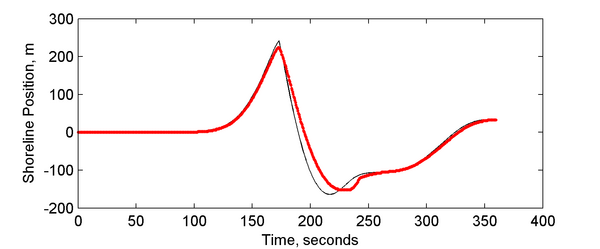
[[Image:Long-wave_Shoreline.png|thumb|none|600px| Figure 2. Comparison of calculated and analytical water levels for different time steps. ]] | |||
'''Table 2. Goodness of Fit Statistics''' | '''Table 2. Goodness of Fit Statistics''' | ||
Revision as of 23:32, 14 January 2011
UNDER CONSTRUCTION
Overview
The goal of this verification test to asses the model performance in simulating nonlinear runup/rundown over a plane slopt. Carrier et al. (2003) presented an analytical solution to the nonlinear shallow water equations over a plane slope for several initial wave forms. Here the analytical solution for a the initial wave form given by leading-depression N-wave is used.
Initial Condition
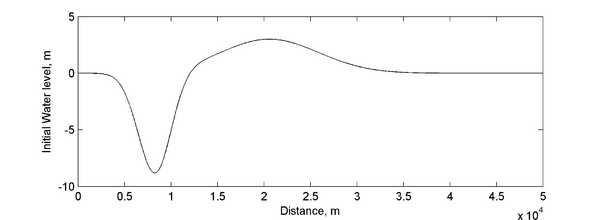
The bed has a constant slope of 1/10 with the initial shoreline located at x=0. Figure 1 shows the initial water level (is given by a leading depression N-wave (characteristic of the waves caused by submarine landslides). The initial current velocity is equal to zero everywhere.
Model Setup
The computational grid has a 3 m resolution for x<300 and increases to 10 m with an aspect ratio of 1.05. The general model parameters used in the simulation are shown in Table 1.
Table 1. Model Parameters
| Parameter | Value |
|---|---|
| Time step | 0.1 s |
| Ramp period | 0.0 s |
| Drying depth | 0.01 m |
| Wall friction | Off |
| Mixing terms | Off |
| Manning's coefficient | 0.0 |
Results
Figure 2 shows a comparison of computed and analytical water surface elevations near the shoreline at 4 different time steps.
Table 2. Goodness of Fit Statistics
| Time, s | RMSE, m | MAE, m | R^2 | Bias, m |
|---|---|---|---|---|
| 160 | 0.047 | 0.461 | 0.999 | -0.069 |
| 175 | 0.058 | 0.304 | 0.998 | -0.239 |
| 220 | 0.042 | 0.261 | 1.000 | -0.055 |
- For a definition of the goodness of fit statistics see Goodness of fit statistics.
References
- Carrier, G., Wu, T.T., and Yeh, H. (2003). "Tsunami runup and draw-down on a plane beach", Journal of Fluid Mechanics, 475, 79-99.


