User Guide 014: Difference between revisions
No edit summary |
No edit summary |
||
| Line 1: | Line 1: | ||
Output Group File Specification | =Output Group File Specification= | ||
For large grids or long simulations, outputting all of the variables to a single XMDF solution file can lead to a file that is unmanageable. To help reduce to the size of the output files each variable group listed in Table 54 can be output into separate files. The table below lists and describes the CMS-Flow cards used to specify the output file names for each variable group. | For large grids or long simulations, outputting all of the variables to a single XMDF solution file can lead to a file that is unmanageable. To help reduce to the size of the output files each variable group listed in Table 54 can be output into separate files. The table below lists and describes the CMS-Flow cards used to specify the output file names for each variable group. | ||
| Line 36: | Line 36: | ||
Figure 2-100. ''Cells'' tab in SMS 11.0 | Figure 2-100. ''Cells'' tab in SMS 11.0 | ||
Table 2-114 | Table 2-114. CMS-Flow card for compressing the XMDF output file | ||
=Simulation Statistics = | |||
CMS V4.0 has the option to calculate statistics over the whole model do-main for a user-specified time period. This option is accessed using the advanced cards. The starting time, end time, and time interval should be specified in hours with respect to the model start time. The time interval should be larger or equal to the hydrodynamic time step. When activated the statistics are written to the XMDF Global Solution File in a subfolder named stats. The CMS-Flow cards related to the statistics are described below. | CMS V4.0 has the option to calculate statistics over the whole model do-main for a user-specified time period. This option is accessed using the advanced cards. The starting time, end time, and time interval should be specified in hours with respect to the model start time. The time interval should be larger or equal to the hydrodynamic time step. When activated the statistics are written to the XMDF Global Solution File in a subfolder named stats. The CMS-Flow cards related to the statistics are described below. | ||
Table 2-115. CMS-Flow cards related to output statistics | |||
Notes: | Notes: | ||
• The units of the starting time, end time, and interval are hours. | |||
• If the interval is not specified, the initial time step is used as the interval. | :• The units of the starting time, end time, and interval are hours. | ||
:• If the interval is not specified, the initial time step is used as the interval. | |||
A description of the hydrodynamic, sediment, salinity statistics is provided in the tables below. | A description of the hydrodynamic, sediment, salinity statistics is provided in the tables below. | ||
Table 2-116. Hydrodynamic Statistics | |||
Table 2-117. Sediment Statistics | |||
Table 2-118.Sediment Statistics | |||
=Diagnostic File= | |||
To Be Completed | To Be Completed | ||
Revision as of 14:29, 5 May 2015
Output Group File Specification
For large grids or long simulations, outputting all of the variables to a single XMDF solution file can lead to a file that is unmanageable. To help reduce to the size of the output files each variable group listed in Table 54 can be output into separate files. The table below lists and describes the CMS-Flow cards used to specify the output file names for each variable group.
Table 2-110. Variable group output file name specification.
Advanced Global Output
In addition to the variables specified in the SMS interface, CMS has the option to output advanced mode output including the bed shear stress, bed composition, wind speed, etc.
Table 2-111. Advanced output datasets.
XMDF File Compression
The standard CMS-Flow output is written to an XMDF file with the name <Case Name>_sol.h5. The binary file may be written in compressed for-mat using the card described in the table below.
Table 2-112. CMS-Flow card for compressing the XMDF output file
ASCII Files
In addition to the XMDF output file, CMS-Flow provides the output two types of ASCII output files:
- 1. Tecplot snap shot (*.dat), and history files (*.his)
- 2. SMS Super ASCII files (*.sup, *.xy, *.dat)
The CMS-Flow cards used for outputting these two types of files are described in the table below.
Table 2-113. CMS-Flow cards used to output Tecplot and SMS Super ASCII
Observation Cells (Save Points)
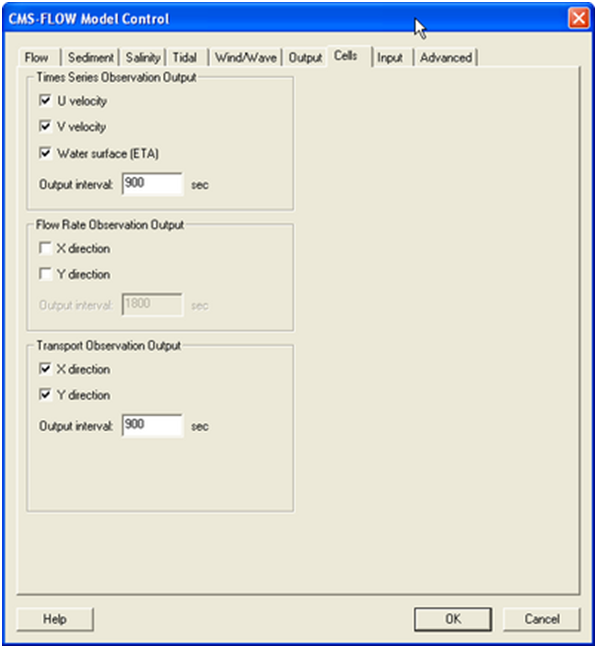
Time series at selected Observation cells is set in the Cells tab of the CMS-Flow Model Control window. A description of CMS-Flow cards used for specifying Observational cells are described below.
Figure 2-100. Cells tab in SMS 11.0
Table 2-114. CMS-Flow card for compressing the XMDF output file
Simulation Statistics
CMS V4.0 has the option to calculate statistics over the whole model do-main for a user-specified time period. This option is accessed using the advanced cards. The starting time, end time, and time interval should be specified in hours with respect to the model start time. The time interval should be larger or equal to the hydrodynamic time step. When activated the statistics are written to the XMDF Global Solution File in a subfolder named stats. The CMS-Flow cards related to the statistics are described below.
Table 2-115. CMS-Flow cards related to output statistics
Notes:
- • The units of the starting time, end time, and interval are hours.
- • If the interval is not specified, the initial time step is used as the interval.
A description of the hydrodynamic, sediment, salinity statistics is provided in the tables below.
Table 2-116. Hydrodynamic Statistics
Table 2-117. Sediment Statistics
Table 2-118.Sediment Statistics
Diagnostic File
To Be Completed
