User Guide 014
Output Group File Specification
For large grids or long simulations, outputting all of the variables to a single XMDF solution file can lead to a file that is unmanageable. To help reduce to the size of the output files each variable group listed in Table 54 can be output into separate files. The table below lists and describes the CMS-Flow cards used to specify the output file names for each variable group.
Table 2-110. Variable group output file name specification.
| Card | Arguments | Default | Description |
|---|---|---|---|
| WSE_OUT_FILE | Character | none | Specifies the XMDF output file name for the water level group |
| VEL_OUT_FILE | Character | none | Specifies the XMDF output file name for the current velocity group |
| EDDY_VISCOSITY_OUT_FILE | Character | none | Specifies the XMDF output file name for the eddy viscosity group |
| VISC_OUT_FILE | Character | none | Specifies the XMDF output file name for the eddy viscosity group (same as card above) |
| TRANS_OUT_FILE | Character | none | Specifies the XMDF output file name for the transport group |
| MORPH_OUT_FILE | Character | none | Specifies the XMDF output file name for the morphology change group |
| WIND_OUT_FILE | Character | none | Specifies the XMDF output file name for the wind group |
Advanced Global Output
In addition to the variables specified in the SMS interface, CMS has the option to output advanced mode output including the bed shear stress, bed composition, wind speed, etc.
Table 2-111. Advanced output datasets.
| Card | Arguments | Default | Description |
|---|---|---|---|
| WIND_OUT_TIMES_LIST | integer | 0 | Output time series id for wind velocity and magnitude in m/s. |
| STRESS_OUT_TIMES_LIST | integer | 0 | Output time series id for mean bed shear stress in Pa. |
| WAVE_OUTPUT_DETAILS | ON
OFF |
OFF | Outputs additional wave variables including wave direction, radiation stresses, breaking dissipation and roller energy. |
XMDF File Compression
The standard CMS-Flow output is written to an XMDF file with the name <Case Name>_sol.h5. The binary file may be written in compressed for-mat using the card described in the table below.
Table 2-112. CMS-Flow card for compressing the XMDF output file
| Card | Arguments | Default | Description |
|---|---|---|---|
| XMDF_COMPRESSION | ON
OFF |
OFF | Compresses the XMDF file |
ASCII Files
In addition to the XMDF output file, CMS-Flow provides the output two types of ASCII output files:
- 1. Tecplot snap shot (*.dat), and history files (*.his)
- 2. SMS Super ASCII files (*.sup, *.xy, *.dat)
The CMS-Flow cards used for outputting these two types of files are described in the table below.
Table 2-113. CMS-Flow cards used to output Tecplot and SMS Super ASCII
| Card | Arguments | Default | Description |
|---|---|---|---|
| GLOBAL_TECPLOT_FILES | ON
OFF |
OFF | Outputs Tecplot ASCII files |
| GLOBAL_SUPER_FILES | ON
OFF |
OFF | Outputs Super ASCII files |
Observation Cells (Save Points)
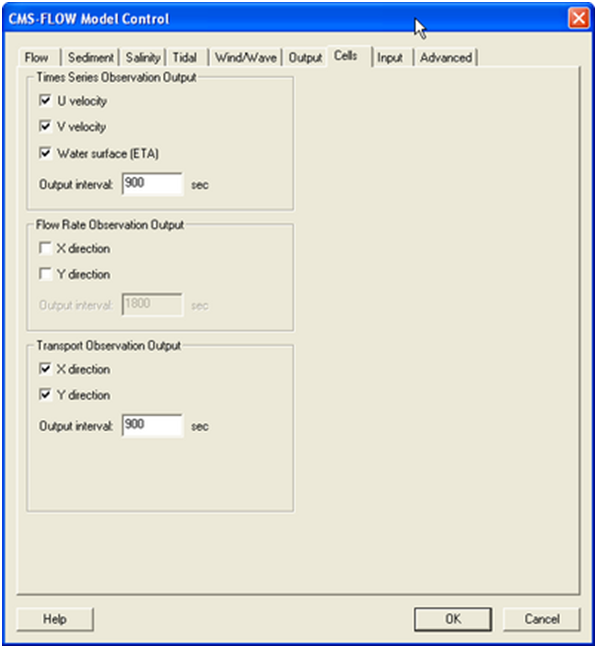
Time series at selected Observation cells is set in the Cells tab of the CMS-Flow Model Control window. A description of CMS-Flow cards used for specifying Observational cells are described below.
Figure 2-100. Cells tab in SMS 11.0
Table 2-114. CMS-Flow card for compressing the XMDF output file
| Card | Arguments | Description |
|---|---|---|
| TIME_SERIES_INCREMENT | real | Sets the output time increment for the Time series Observation points. |
| ELEV_OBS_CELLS_BEGIN | none | Marks the beginning of a Times series Observation point list. |
| ELEV_OBS_CELLS_END | none | Marks the end of a Times series Observation point list. |
| FLOW_RATE_INCREMENT | real | Sets the output time increment for the Flow rate Observation points. |
| FLOW_OBS_CELLS_BEGIN | none | Marks the beginning of a Flow rate Observation point list. |
| FLOW_OBS_CELLS_END | none | Marks the end of a Flow rate Observation point list. |
| Q_TRANS_INCREMENT | real | Sets the output time increment for the Flow rate Observation points. |
| Q_TRANS_OBS_CELLS_BEGIN | none | Marks the beginning of a Transport Observation point list. |
| Q_TRANS_OBS_CELLS_BEGIN | none | Marks the end of a Transport Observation point list. |
Simulation Statistics
CMS V4.0 has the option to calculate statistics over the whole model do-main for a user-specified time period. This option is accessed using the advanced cards. The starting time, end time, and time interval should be specified in hours with respect to the model start time. The time interval should be larger or equal to the hydrodynamic time step. When activated the statistics are written to the XMDF Global Solution File in a subfolder named stats. The CMS-Flow cards related to the statistics are described below.
Table 2-115. CMS-Flow cards related to output statistics
| Card | Arguments | Description |
|---|---|---|
| GLOBAL_STATISTICS | [start time] [end time] [interval] | Turns on the statistics for hydrodynamics, sediment transport, and salinity. |
| FLOW_STATISTICS | [start time] [end time] [interval] | Turns on the statistics for hydrodynamics transport. |
| SEDIMENT_STATISTICS | [start time] [end time] [interval] | Turns on the statistics sediment transport. |
| SALINITY_STATISTICS | [start time] [end time] [interval] | Turns on the statistics for salinity. |
Notes:
- • The units of the starting time, end time, and interval are hours.
- • If the interval is not specified, the initial time step is used as the interval.
A description of the hydrodynamic, sediment, salinity statistics is provided in the tables below.
Table 2-116. Hydrodynamic Statistics
| Statistic Name | Dataset | Description |
|---|---|---|
| Maximum Current Velocity Vector | Current_Max | Maximum current velocity vector in m/s. Can be either negative or positive. |
| Maximum Current Velocity Magnitude | Current_Max_Mag | Maximum current velocity magnitude in m/s. |
| Maximum Water Level | Water_Level_Max | Maximum water level in m. |
| Residual Current Velocity Vector | Current_Velocity | Average current velocity vector in m/s. |
| Residual Current Velocity Magnitude | Current_Velocity_Mag | Average current velocity magnitude in m/s. |
| Hydroperiod | Hydroperiod | Fraction of time a computational cell is wet (i.e. 0-never dry, 1-always wet). |
| Maximum water level gradient magnitude WSE_Grad_Max_Mag | Maximum water level gradient magnitude in m/m. | |
| Maximum current velocity gradient magnitude | Cur_Grad_Max_Mag | Maximum current velocity gradient |
| Average x-Velocity Normalized L-2 Norm | Vx_Norm_Res | Average normalized L-2 norm of the momentum equation in the x-direction |
| Average y-Velocity Normalized L-2 Norm | Vy_Norm_Res | Average normalized L-2 norm of the momentum equation in the y-direction |
| Average Pressure Normalized L-2 Norm | Pres_Norm_Res | Average normalized L-2 norm of the pressure correction equation. The pressure is in units of m2/s2. |
Table 2-117. Sediment Statistics
| Statistic Name | Dataset | Description |
|---|---|---|
| Maximum Total-load Sediment Transport Rate vector | Sed_Transp_Max | Maximum total-load sediment transport rate vector in units of kg/m/s. Can be either negative or positive. |
| Maximum Total-load Sediment Transport Rate Magnitude | Sed_Transp_Max_Mag | Maximum total-load sediment transport rate magnitude in units of kg/m/s. |
| Net Total-load Sediment Transport Rate Magnitude | Sed_Transp_Net | Net total-load sediment transport rate vector in units of kg/m/s. Can be either negative or positive. |
| Net Total-load Sediment Transport Rate Magnitude | Sed_Transp_Net_Mag | Net total-load sediment transport rate magnitude in units of kg/m/s. |
| Gross Total-load Sediment Transport Rate Magnitude | Sed_Transp_Gross | Gross total-load sediment transport rate vector in units of kg/m/s. Can be either negative or positive. |
| Gross Total-load Sediment Transport Rate Magnitude | Sed_Transp_Gross_Mag | Gross total-load sediment transport rate magnitude in units of kg/m/s. |
| Maximum Bed Slope Gradient Magnitude | Bed_Grad_Max_Mag | Maximum gradient of the bed slope in units of m/m. |
Table 2-118.Sediment Statistics
| Statistic Name | Dataset | Description |
|---|---|---|
| Average Salinity Concentration | Salinity_Avg | Average salinity concentration in units of ppt. |
Diagnostic File
To Be Completed

