Utilities: Difference between revisions
Jump to navigation
Jump to search
No edit summary |
|||
| Line 1: | Line 1: | ||
<big> | <big> | ||
= Time Series Analysis = | |||
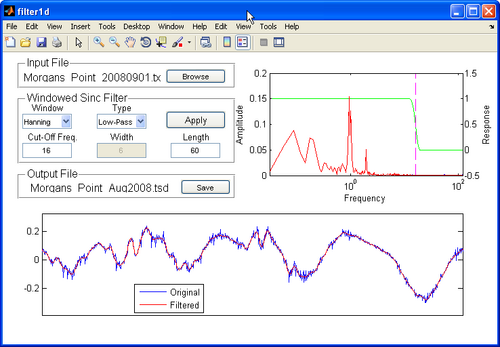
[[File:filter1d.png|thumb|right|500px|filter1d.m]] | [[File:filter1d.png|thumb|right|500px|filter1d.m]] | ||
== Filter1D: Time Series Analysis Tool == | |||
* The Matlab utility provides users of the SMS, a one-stop package for preparing model input time series and allows users to interpolate, resample, filter, and transform any type of model forcing and supports SMS compatible file formats for ease of data transfer. | * The Matlab utility provides users of the SMS, a one-stop package for preparing model input time series and allows users to interpolate, resample, filter, and transform any type of model forcing and supports SMS compatible file formats for ease of data transfer. | ||
* The main feature of the software is the ability to apply high-pass, low-pass, band-pass, and band-stop filters to time series. | * The main feature of the software is the ability to apply high-pass, low-pass, band-pass, and band-stop filters to time series. | ||
| Line 12: | Line 12: | ||
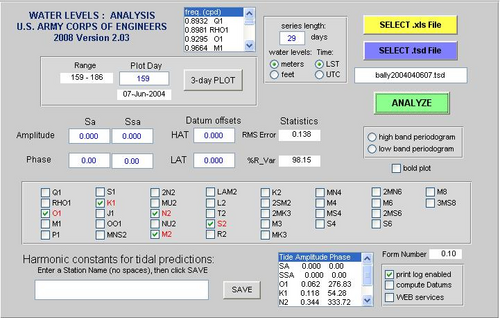
[[File:TAPtides.png|thumb|right|500px|TAP Interface]] | [[File:TAPtides.png|thumb|right|500px|TAP Interface]] | ||
== TAP: Tidal Analysis and Prediction software == | |||
** TAPtides is the ideal package to explore and develop preliminary or finalized tidal predictions from serial records spanning several weeks to several months. | ** TAPtides is the ideal package to explore and develop preliminary or finalized tidal predictions from serial records spanning several weeks to several months. | ||
** Designed to be easy to use, its Graphical User Interface permits quick separation of a time series of water level measurements into its tidal and non-tidal components using a selective least squares harmonic reduction employing up to 35 tidal constituents. | ** Designed to be easy to use, its Graphical User Interface permits quick separation of a time series of water level measurements into its tidal and non-tidal components using a selective least squares harmonic reduction employing up to 35 tidal constituents. | ||
| Line 22: | Line 22: | ||
<br style="clear:both" /> | <br style="clear:both" /> | ||
= Post-processing = | |||
* [[proc_flux | Sediment transport integration tool]] | * [[proc_flux | Sediment transport integration tool]] | ||
= Matlab scripts = | |||
==Read CMS-Flow solution files== | |||
* Description: Reads the CMS-Flow XMDF (*.h5) solution file in Matlab. Can read individual datasets are the whole solution. | * Description: Reads the CMS-Flow XMDF (*.h5) solution file in Matlab. Can read individual datasets are the whole solution. | ||
* Usage: | * Usage: | ||
| Line 36: | Line 36: | ||
<br style="clear:both" /> | <br style="clear:both" /> | ||
==Read SMS Time Series Data File == | |||
* Reads the Surface-water Modeling System time-series data (*.tsd) file in Matlab. | * Reads the Surface-water Modeling System time-series data (*.tsd) file in Matlab. | ||
* Usage: | * Usage: | ||
| Line 43: | Line 43: | ||
<br style="clear:both" /> | <br style="clear:both" /> | ||
== Bin scatter data == | |||
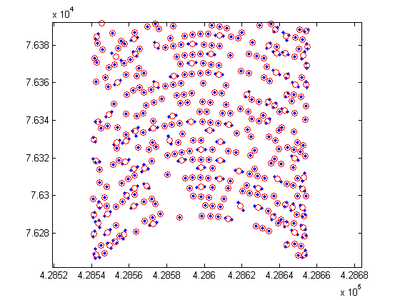
[[Image:xyzbin_swath_5m.png|thumb|right|400px| Example of xyzbin.m application to multibeam data with 5-m bins. ]] | [[Image:xyzbin_swath_5m.png|thumb|right|400px| Example of xyzbin.m application to multibeam data with 5-m bins. ]] | ||
* Description: Averages the x, y, and z values of points within the same bin. The grid used to define the bins may be user specified are calculated based on the extent of the scatter points. | * Description: Averages the x, y, and z values of points within the same bin. The grid used to define the bins may be user specified are calculated based on the extent of the scatter points. | ||
| Line 55: | Line 55: | ||
<br style="clear:both" /> | <br style="clear:both" /> | ||
== Extract Time Series from NOAA World Blended Sea Winds == | |||
* Description: Extracts a time series of wind speed and direction for use in CMS from the 6 hrly global blended sea wind database (http://www.ncdc.noaa.gov/oa/rsad/air-sea/seawinds.html) which has a 0.25º resolution. Outputs *.xys files which can easily be imported into SMS. | * Description: Extracts a time series of wind speed and direction for use in CMS from the 6 hrly global blended sea wind database (http://www.ncdc.noaa.gov/oa/rsad/air-sea/seawinds.html) which has a 0.25º resolution. Outputs *.xys files which can easily be imported into SMS. | ||
* Download Matlab script [[Media:blended_winds_extract_time_series.rar| blended_winds_extract_time_series.m ]] | * Download Matlab script [[Media:blended_winds_extract_time_series.rar| blended_winds_extract_time_series.m ]] | ||
| Line 63: | Line 63: | ||
<br style="clear:both" /> | <br style="clear:both" /> | ||
= HDFview = | |||
* HDFview is a free visualziation tool for browsing and editing HDF4 and HDF5 files. | * HDFview is a free visualziation tool for browsing and editing HDF4 and HDF5 files. | ||
* To download or download a free copy visit: | * To download or download a free copy visit: | ||
: http://www.hdfgroup.org/hdf-java-html/hdfview/index.html | : http://www.hdfgroup.org/hdf-java-html/hdfview/index.html | ||
= Grain Size Distribution Analysis = | |||
* This Excel worksheet calculates statistics for many samples using several methods including Folk and Ward and the Method of Moments. | * This Excel worksheet calculates statistics for many samples using several methods including Folk and Ward and the Method of Moments. | ||
: http://www.cedex.es/pipermail/rivers-list/attachments/20061004/56b4085f/gradistat-0001.xls | : http://www.cedex.es/pipermail/rivers-list/attachments/20061004/56b4085f/gradistat-0001.xls | ||
| Line 74: | Line 74: | ||
<br style="clear:both" /> | <br style="clear:both" /> | ||
= Wave Transformation = | |||
* [[media:Ww3-spectra.zip | Wave Watch III spectra]] | * [[media:Ww3-spectra.zip | Wave Watch III spectra]] | ||
* [[media:Wis-spectra.zip | WIS wave spectra]] | * [[media:Wis-spectra.zip | WIS wave spectra]] | ||
Revision as of 22:30, 20 January 2011
Time Series Analysis
Filter1D: Time Series Analysis Tool
- The Matlab utility provides users of the SMS, a one-stop package for preparing model input time series and allows users to interpolate, resample, filter, and transform any type of model forcing and supports SMS compatible file formats for ease of data transfer.
- The main feature of the software is the ability to apply high-pass, low-pass, band-pass, and band-stop filters to time series.
- Filter1D uses a windowed sinc filter which is a non-recursive finite impulse response filter.
- Wiki Manual Filter1d
- Download Matlab script filter1d.m
TAP: Tidal Analysis and Prediction software
- TAPtides is the ideal package to explore and develop preliminary or finalized tidal predictions from serial records spanning several weeks to several months.
- Designed to be easy to use, its Graphical User Interface permits quick separation of a time series of water level measurements into its tidal and non-tidal components using a selective least squares harmonic reduction employing up to 35 tidal constituents.
- After saving the tidal constants for the constituents selected during analysis, the user can generate predictions of the astronomical tide, the water level that varies at known tidal frequencies attributable to gravitational interactions between the earth, moon, and sun.
- Wiki Manual for TAPtides TAPtides
- Wiki Manual for TAPcurrents TAPcurrents
- Download software TAP.rar
Post-processing
Matlab scripts
Read CMS-Flow solution files
- Description: Reads the CMS-Flow XMDF (*.h5) solution file in Matlab. Can read individual datasets are the whole solution.
- Usage:
     filename = 'test_sol.h5';
     sol = readcmsh5(filename);
     wse = readcmsh5(filename,'Water_Elevation');
     [wse,uv] = readcmsh5(filename,'Water_Elevation','Current_Velocity');
- Download Matlab script readcmsh5.m
Read SMS Time Series Data File
- Reads the Surface-water Modeling System time-series data (*.tsd) file in Matlab.
- Usage:
[t,dat,name,units] = read_tsd(file);
- Download Matlab script read_tsd.m
Bin scatter data
- Description: Averages the x, y, and z values of points within the same bin. The grid used to define the bins may be user specified are calculated based on the extent of the scatter points.
- Usage:
    [x,y,z] = xyzbin(...)
    [x,y,z] = xyzbin('infile',infile,'outfile',outfile,'dx',dx)
    [x,y,z] = xyzbin('x',xin,'y',yin,'z',zin,'dx',dx)
    [x,y,z] = xyzbin('x',xin,'y',yin,'z',zin,'dx',dx,'dy',dy)
    [x,y,z] = xyzbin('infile',infile,'dx',dx,'x0',x0,'y0',y0,'theta',theta)
- Download Matlab script xyzbin.m:
Extract Time Series from NOAA World Blended Sea Winds
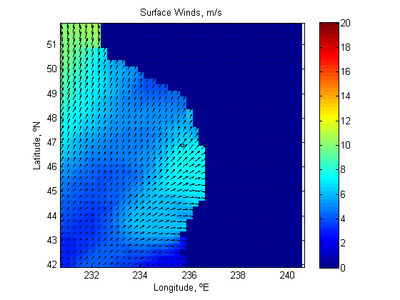
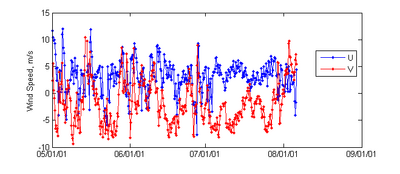
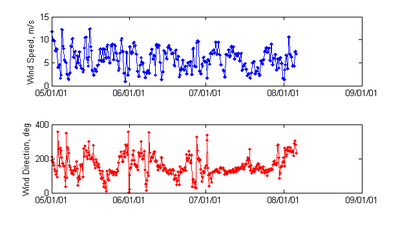
- Description: Extracts a time series of wind speed and direction for use in CMS from the 6 hrly global blended sea wind database (http://www.ncdc.noaa.gov/oa/rsad/air-sea/seawinds.html) which has a 0.25º resolution. Outputs *.xys files which can easily be imported into SMS.
- Download Matlab script blended_winds_extract_time_series.m
HDFview
- HDFview is a free visualziation tool for browsing and editing HDF4 and HDF5 files.
- To download or download a free copy visit:
Grain Size Distribution Analysis
- This Excel worksheet calculates statistics for many samples using several methods including Folk and Ward and the Method of Moments.
