Visser: Difference between revisions
No edit summary |
|||
| Line 1: | Line 1: | ||
== Setup == | == Setup == | ||
In 1991, Visser conducted eight laboratory experiments of monochromatic wave on a planar beach and collected measurements on waves, currents and water levels. The bathymetry consisted of a 1:10 slope for the first 1-m seaward distance, a 1:20 slope for the next 5-m distance, followed by a 5.9 m distance of flat bottom to the wave generator. Both experiments had incident wave heights of 0.078 m, peak periods of 1.02 sec and an incident wave angle of 15.4°. Experiment 4 was run over a concrete bed and experiment 7 was run of a thin 0.005-0.01 m layer of gravel grouted on the concrete floor. | In 1991, Visser conducted eight laboratory experiments of monochromatic wave on a planar beach and collected measurements on waves, currents and water levels. The bathymetry consisted of a 1:10 slope for the first 1-m seaward distance, a 1:20 slope for the next 5-m distance, followed by a 5.9 m distance of flat bottom to the wave generator. Both experiments had incident wave heights of 0.078 m, peak periods of 1.02 sec and an incident wave angle of 15.4°. Experiment 4 was run over a concrete bed and experiment 7 was run of a thin 0.005-0.01 m layer of gravel grouted on the concrete floor. | ||
{| border="1" | |||
! Wave Parameter !! Case 4 !! Case 7 | |||
|- | |||
| Height || 0.08 m || 0.08 m | |||
|- | |||
| Period || 1.02 m || 1.02 m | |||
|- | |||
| Direction || 15.4°|| 15.4° | |||
|} | |||
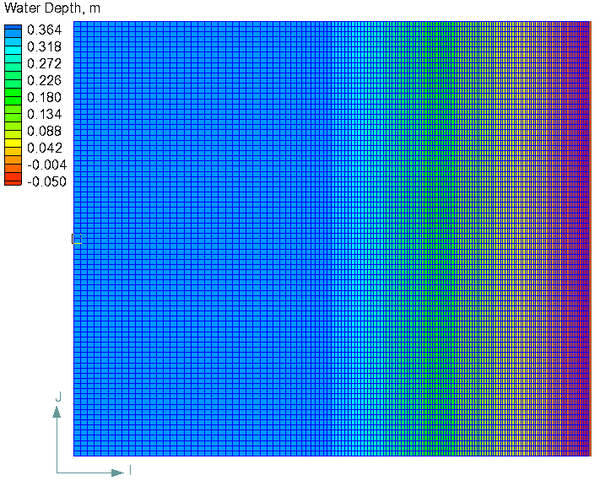
The computational grid (shown in Figure 1) consists of 84 rows and 147 columns with a constant grid resolution in the longshore direction of 0.15 and a variable grid resolution between 0.04 and 0.15 m in the cross-shore direction. A zero water level was forced at the offshore boundary. | The computational grid (shown in Figure 1) consists of 84 rows and 147 columns with a constant grid resolution in the longshore direction of 0.15 and a variable grid resolution between 0.04 and 0.15 m in the cross-shore direction. A zero water level was forced at the offshore boundary. | ||
Revision as of 14:14, 13 October 2010
Setup
In 1991, Visser conducted eight laboratory experiments of monochromatic wave on a planar beach and collected measurements on waves, currents and water levels. The bathymetry consisted of a 1:10 slope for the first 1-m seaward distance, a 1:20 slope for the next 5-m distance, followed by a 5.9 m distance of flat bottom to the wave generator. Both experiments had incident wave heights of 0.078 m, peak periods of 1.02 sec and an incident wave angle of 15.4°. Experiment 4 was run over a concrete bed and experiment 7 was run of a thin 0.005-0.01 m layer of gravel grouted on the concrete floor.
| Wave Parameter | Case 4 | Case 7 |
|---|---|---|
| Height | 0.08 m | 0.08 m |
| Period | 1.02 m | 1.02 m |
| Direction | 15.4° | 15.4° |
The computational grid (shown in Figure 1) consists of 84 rows and 147 columns with a constant grid resolution in the longshore direction of 0.15 and a variable grid resolution between 0.04 and 0.15 m in the cross-shore direction. A zero water level was forced at the offshore boundary.
Results
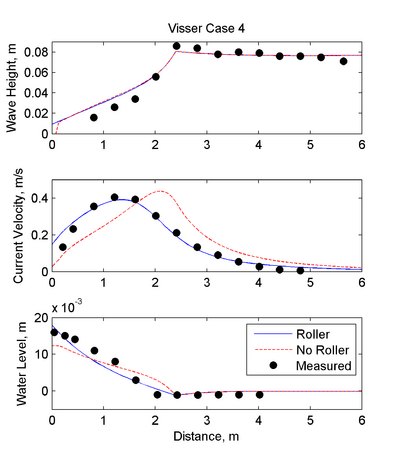
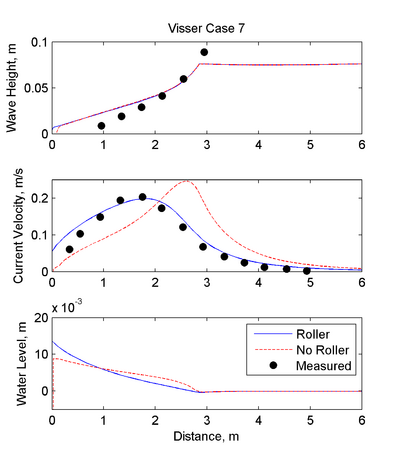
The figures below show a comparison between measured and computed bed elevations.
References
- Visser, R. J. (1991) “Laboratory measurements of uniform longshore currents”. Coastal Engineering, 15, 563-593.


