Cape Fear Inlet
UNDER CONSTRUCTION
Project Objectives
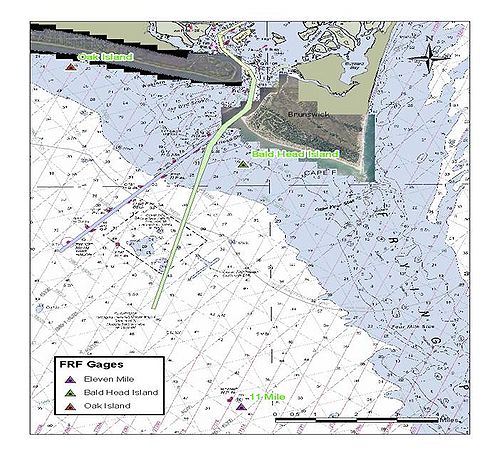
The Coastal Modeling System was applied to compute tidal hydrodynamics, wave transformation, sediment transport and morphology change in the Cape Fear Inlet area. Wave and current data collected for the Wilmington Harbor Monitoring Program were used to calibrate the CMS wave and flow models. The objective of the study was to use the calibrated models to examine the flow patterns, wave fields and sediment transport in the area and to estimate potential littoral transport which enters Cape Fear Inlet from Oak Island and Bald Head. Also, the impact of the channel realignment on wave climate, flow pattern and sediment transport was investigated.
Model Setup
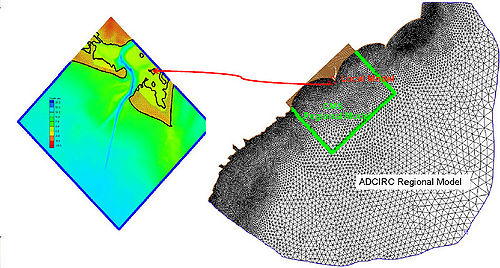
The calibrated CMS-WAVE and CMS-FLOW models were coupled using the Steering Module to evaluate the flow patterns and to drive the PTM model in the Cape Fear Inlet area during principal wave condition. The CMS model was used in a nested grid configuration. The wave model grid covered a 16 x 16 km area using a refined grid. The flow model grid was designed much more locally to the project site.
Validation
Verification of the CMS-FLOW model was based on measured currents across the mouth of the Cape Fear River tidal inlet during March 10, 2008. The agreement between the modeled and measured current was good.
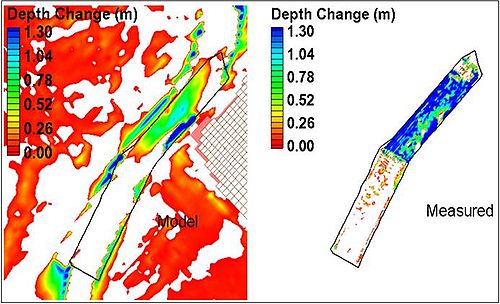
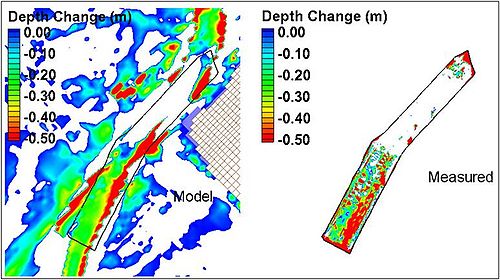
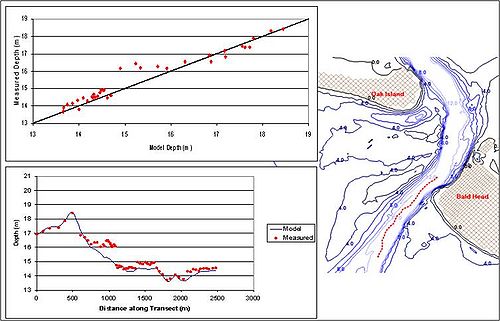
The CMS sediment model was calibrated by comparing the modeled morphological changes in the Cape Fear area between September and November of 2008 with available (September 9 and October 20) surveyed channel data. The median grain size in the channel area was investigated by examining available borehole data in the area. A D50 value of 0.3 mm was selected in the channel area and a D50 of 0.2 mm was adopted elsewhere within the model domain.
The model, in general, reproduced the measured bed elevation with reasonable accuracy. Poor agreement between measured and modeled data was observed in the turning area between Reach 1 and Reach 2 (transect distance 700-1000 m). This might be due to the limited capability of the model to simulate morphology details around turning areas with complicated 3-D effects.
Discussion
References
- Project information provided by Wilmington District by Layla Kashlan