Culvert Tests
Culvert Application at White Ditch, LA

Located southeast of New Orleans on the coast of Louisiana, the White Ditch area has been experiencing the shortage of fresh water, sediments and nutrients from the Mississippi River, and saltwater intrusion due to sea level rise and storms. As a result, extensive wetland loss and degradation of tidal marshes has occurred in the area through the years. A hydrodynamic and salinity modeling analysis was conducted by URS (2010) to evaluate alternative designs for a fresh water diversion from the Mississippi River to the project area. The alternatives were evaluated in terms of their impact on water depths and salinities throughout the study area.
Two alternative locations (Locations 2 and 3) are proposed for the diversion near White Ditch. Location 2 uses a modification of the existing siphon at White Ditch. Location 3 is located farther to the south. At both alternative locations different channel depths and widths are considered for different peak diversion flow rates, ranging from 5,000 to 100,000 cfs. Location 2 also includes culverts located throughout the modified channels to provide connectivity with the marsh areas.
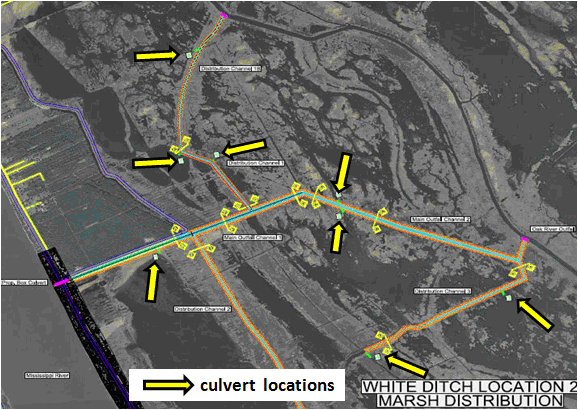
The alternative design at Location 2 is connected to the Mississippi River with a box culvert and consists of two main outfall channels and three distribution channels, as indicated in Figure 10. The channels are flanked by levees that constrain the flow within the channels until reaching the downstream ends of the channels. Culverts are distributed along the channels to provide connectivity to the wetlands, and plugs are placed at some junctures to control the flow.
At each of the two alternative locations, six design diversion flow rates were considered. For each flow rate a different channel cross-sectional area was used. The number of culverts was also varied at Location 2 for each design flow. Conditions for the six unique grid configurations for Location 2 are shown in Table 5.
Table 5. Configuration for Location 2 Alternative Designs.
| Scenario | White Ditch Diversion Flow Rate (cfs) | Number of Culverts at Each Location | Total Culvert Cross-Sectional Area (ft2) |
| 1 | 5,000 | 4 to 8 | 367 |
| 2 | 10,000 | 6 to 12 | 551 |
| 3 | 15,000 | 10 to 20 | 918 |
| 4 | 35,000 | 15 to 30 | 1377 |
| 5 | 70,000 | 30 to 60 | 2755 |
| 6 | 100,000 | 50 to 100 | 4592 |

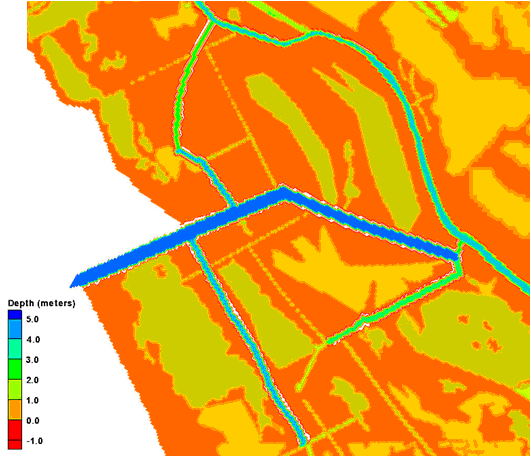
A 2-D CMS-Flow model was developed and calibrated to evaluate each design. Details of the model configuration and calibration can be found in URS (2010). The model domain extends about 60 km along the NW-SE directions and about 30 km along the SW-NE direction, and includes the Mississippi River levees, the Mississippi River-Gulf Outlet (MRGO) channel, and other features. The size of the CMS grid cells ranges from 24 to 600 m with the fine grid along the White Ditch (Mississippi River) and the coarse grid in the Gulf of Mexico. Figure 6 shows a view of the CMS grid bathymetry in the vicinity of the Location 2 alternative diversion. The channels and channel elves are evident. The grid includes specification of the culverts per the alternative design schematics. The culverts were assumed to have a circular cross-section with 3 foot diameter, and 10 foot length.
The CMS model boundary conditions included tidal elevations at the offshore boundary, freshwater flow at the Caernarvon Diversion, and freshwater inputs at the proposed White Ditch diversion. Tide data from the U.S. Geological Survey (USGS) station (7374527) at Northeast Bay Gardene near Point-A-LA-Hache, LA was used as the tide boundary. Freshwater flows were measured by the New Orleans District, USACE, and were used at the Caernarvon flow boundary.
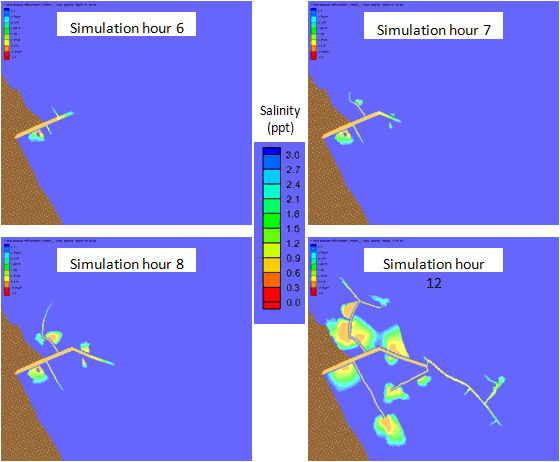
Figure 7shows a time-series of snap shots of the freshwater flowing from the diversion, through the diversion channels and into the wetlands. The flow through the culverts is evident at each culvert location as indicated by the growing freshwater area.

References
- Buttolph, A. M., C. W. Reed, N. C. Kraus, N. Ono, M. Larson, B. Camenen, H. Hanson, T. Wamsley, and A. K. Zundel, A. K. 2006. Two-dimensional depth-averaged circulation model CMS-M2D: Version 3.0, Report 2, sediment transport and morphology change. Coastal and Hydraulics Laboratory Technical Report ERDC/CHL-TR-06-7. Vicksburg, MS: U.S. Army Engineer Research and Development Center.
- Bodhaine, G.L., 1982, "Measurement of Peak Discharge at Culverts by Indirect Methods," Techniques of Water Resources Investigations of the United States Geological Survey, Book 3, Chapter A3, U.S. Geological Survey, WA.
- Militello, A., Reed, C.W., Zundel, A.K., and Kraus, N.C. 2004. Two-Dimensional Depth-Averaged Circulation Model M2D: Version 2.0, Report 1, Technical Documentation and User’s Guide, ERDC/CHL TR-04-2, U.S. Army Research and Development Center, Coastal and Hydraulics Laboratory, Vicksburg, MS.
- URS. 2010. USACE White Ditch evaluation and design – hydrodynamic and salinity transport modeling. URS Corporation, Tallahassee, FL.