Gencade Representation of Inlets
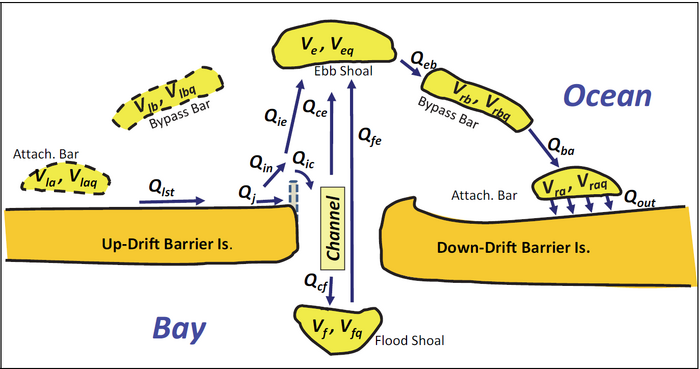
GenCade employs the Inlet Reservoir Model (IRM) as first presented in Kraus (2000) and further developed by Larson et al. (2003, 2006). Each inlet is represented by six morphological elements (shoals and bars) plus the inlet channel (Figure 1). Each morphological element is, in turn, represented by an actual sand volume and an equilibrium volume , where the subscript x is a placeholder for a (attachment bars), b (bypass bars), e (ebb shoal), or f (flood shoal). Each morphological element is assumed to have a certain equilibrium volume for fixed hydrodynamic and sediment conditions. The flux of sediment out of each morphological element is given by:
where represents the flux out of the element x and is the flux into the element. The attachment and bypass bars also have a third index, l or b, in front of the other two, where index l stands for the left side of the inlet and index r stands for the right side when looking seaward from land. When the sediment transport goes from left to right, the attachment and bypass bars on the left-hand side of the inlet are not active, as the sediment is assumed to be transferred from the beach on the left-hand side onto the ebb shoal without passing through the attachment and bypass bars on that side. The corresponding situation occurs as sediment is moving from right to left.
In Figure 1, the transport goes from left to right. A transport rate is moving alongshore towards the inlet, which may or may not be stabilized by a jetty. If there is a jetty, a portion of this sediment will be trapped by the jetty (thus, when no jetty, ) whereas the remaining part will enter into the inlet system. A fraction of this flux may go to the ebb shoal, , depending on how full the ebb and flood shoals are with respect to the equilibrium volume, while the other portion, , will go into the inlet channel. This will, in turn, feed the ebb and flood shoals in proportion to their relative volumes.
Unless the system is completely full at equilibrium, only a portion of the incoming rate will leave the inlet system and be transported further along the beach. Initial and equilibrium volumes of the respective morphological elements are specified as input values to the model as are the respective locations of the attachment bars.

Walton and Adams (1976) derived empirical equations for the equilibrium ebb shoal volume based on field data from 43 United States inlets. Walton and Adams’ definition of the ebb shoal approximately corresponds to the sum of the IRM’s volumes of the ebb shoal and bypass bars. To employ these equations for computing of the different morphologic units, some assumptions must be made concerning the size relationship among them. Historical aerial photographs or bathymetric surveys can be employed to determine the relative proportions of the morphological elements. To represent an inlet that does not have ANY impact on adjacent beaches the inlet needs to fulfill ALL the three conditions below:
- Have no jetties on either side of the channel
- Have all morphological units completely full where the initial volume of the morphological elements is equal to the equilibrium volume
- on either side is released only to the first cell adjacent to the inlet
Ocean City, MD Example
As an illustration of the use of the inlet module in GenCade, an example from Ocean City, Maryland, will be briefly presented. Beaches south of Ocean City Inlet have experienced long-term shoreline recession caused by impoundment of southerly-directed longshore transport by the north jetty and capture of additional sand by the ebb tidal shoal complex. The sediment trapping capacity of the north jetty has effectively reached its maximum, with most of the sediment transported southward bypassing the jetty (Stauble et al. 1993). This sediment deposits in the entrance channel of the inlet, settles on the ebb-tidal shoal, or bypasses the inlet and supplies Assateague Island south of the inlet with material.
Since the Ocean City Inlet opened in 1933, the evolution and migration of the ebb-tidal shoal, the bypass bar, and the attachment bar have been monitored. In this particular study, only the volumetric evolution was considered to validate the IRM.
The net sediment transport at the site is estimated at from north to south (Stauble et al. 1993). Equilibrium volumes of the morphological units at the inlet are estimated to be for the ebb-tidal shoal, for the bypass bar, and for the attachment bar.
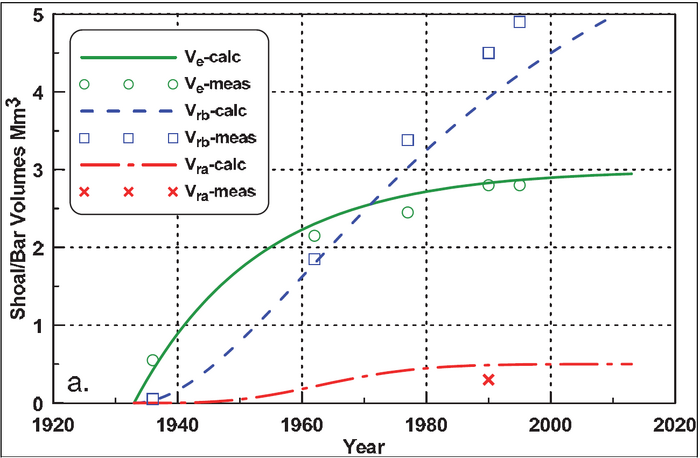
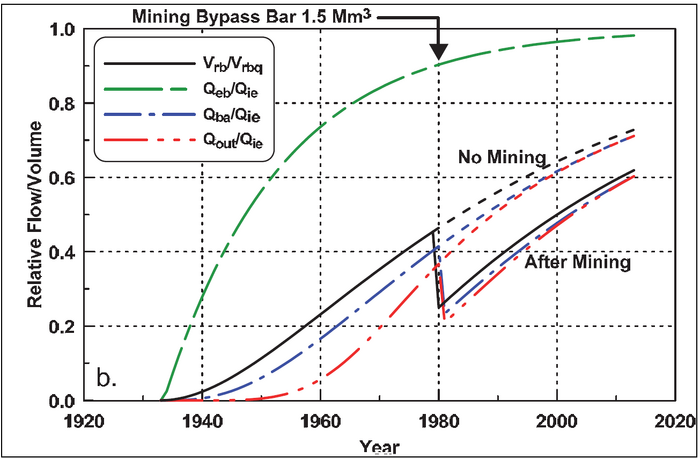
Based on these numbers, the GenCade model was run for the period from 1933 to 2013 over which period the volumetric evolution of the morphological units at the inlet were calculated (Figure 2). The symbols represent measured volumes and the lines calculated volumes. The model reproduces the measured values quite well. Based on the same numbers, it is now possible to calculate other quantities such as bypassing rates. Figure 3 (upper, dashed ‘No Mining’ lines) plots the values relative to the incoming longshore net transport rate. As the ebb-tidal shoal is reaching its equilibrium volume around year 2000, the relative bypass rate accordingly reaches unity. Similarly, as the attachment bar reaches its equilibrium volume around the same time, the transport rate out of that morphological unit equals the rate coming in, i.e., the rate bypassed from the bypass bar. Because the bypass is still not near its equilibrium volume, its relative bypass rate is far from unity.


With the inlet bypass representation in the GenCade model being verified, it is possible to use the model to evaluate alternatives for mining the different morphological elements of the inlet system. This capability is illustrated by a schematic example. The example involves mining 1.5 Mm3 of the bypass bar in 1980 (Figure 3, lower, solid and dash-dotted ‘After Mining’ lines). Because the bypass bar is down-drift of the ebb-tidal shoal, this latter unit will not be affected by the operation. On the other hand, the operation has an immediate effect on the relative transport rates from the bypass bar and the attachment bar, respectively. As seen in Figure 3, the volumetric development of the bypassing bar was set back 20 years. At the same time, the bypassing rate was set back 17 years for the same feature. Due to the reduced influx to the attachment bar, the bypassing rate from this feature, which is the rate that is transported to the down-drift beach, was set back 12 years. Thus, the bypassing rate to the down-drift beach was initially reduced to 54 percent of the undisturbed value. After 33 years, this number has increased to 85 percent. For this scenario, the volumetric situation in the inlet system is back to normal after about 15 years after which, in principle, the dredging operation could be repeated. This presumes, of course, that the impact on the down-drift beach is either acceptable or remedied.