GenCade Boundary Conditions
Boundary Conditions in GenCade
The lateral boundary condition information is included in the GenCade Model Control window under the GenCade menu. GenCade presently has three options for boundary conditions: pinned, moving, and gated. A boundary specified as pinned means that boundary will not move from the initial shoreline position. This is also the default boundary condition. If a moving boundary condition is selected, the boundary will move a specified distance over a certain time period (specified by the user). A gated boundary condition is bounded with a groin.
Pinned
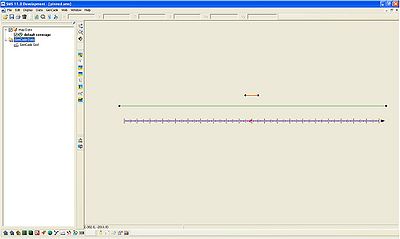
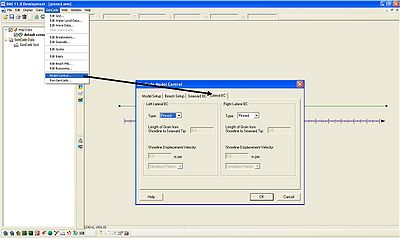
If the lateral boundary conditions (Lateral BC tab) are not changed, the defaulted pinned boundary condition will be used. A simple example is shown below. In this simple case, there is a straight shoreline with one breakwater at the center of the grid. The waves are idealized (H = 0.5 m, T = 6 s, wave direction = 30 degrees), and the simulation is run for two years. Figure 1 shows the setup in GenCade. After selecting Model Control in the GenCade menu, the GenCade Model Control window will open. The last tab under GenCade Model Control is Lateral BC. When the pinned boundary condition is selected, all of the other options in the tab are grayed out.
The boundary conditions are specified in the *.gen file under the heading "BEACH." LBCTYPE refers to the left boundary condition while RBCTYPE refers to the right boundary condition. For the pinned boundary condition, LBCTYPE and RBCTYPE will be 0. Since all of the other options in the Lateral BC window were grayed out, all of the other variables related to boundary conditions in the *.gen file will also be zero.
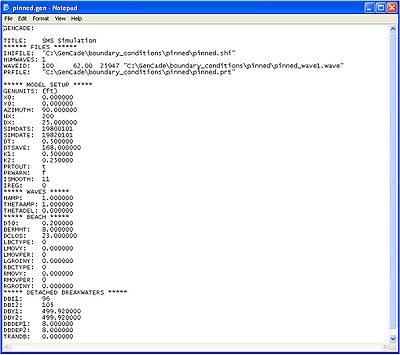
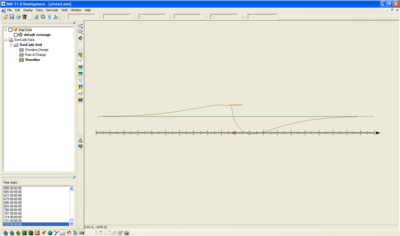
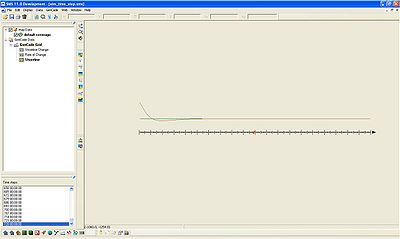
Figure 4 shows the modeled shoreline after a two year simulation. Since both boundaries are pinned, the shoreline at the extents of the grid does not change. Since the grid is only 5000 ft long, it is possible that shoreline change should occur at the extents of the grid. Therefore, for this case, a larger grid may be necessary.
Moving
A moving boundary represents the amount of shoreline change at a boundary over a specified period of time. Under the Lateral BC tab in GenCade Model Control, select Moving under type. After selecting Moving, the shoreline displacement velocity options will be activated. The shoreline can be displaced over the simulation, day, or time step.
Displacement Per Simulation
The first option for a moving boundary condition is shoreline displacement per simulation period. This means that the total displacement of the shoreline during the simulation is equal to the number entered by the user under shoreline displacement velocity. If the units of the grid are specified in feet, the shoreline displacement velocity will also be in feet.
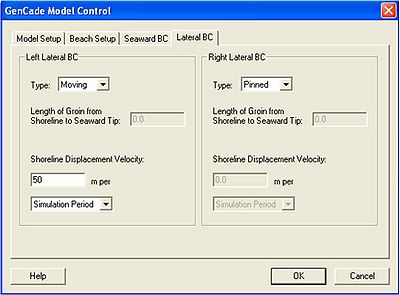
The *.gen file for a simple example is shown below. This simple example is identical to the example for the pinned boundary except the left boundary is now a moving boundary and the breakwater has been removed. The right boundary is still a pinned boundary. In the *.gen file, LBCTYPE, LMOVY, and LMOVPER are related to the moving boundary condition.
In Figure 6, LBCTYPE = 3 refers to a moving boundary condition. LMOVY represents the shoreline displacement over the time period specified. In this example, LMOVY is 50. This number is specified in the SMS. LMOVPER refers to the time period the displacement occurs. LMOVPER = 1, for a displacement over the entire simulation. An example *.gen file is shown in Figure 6.
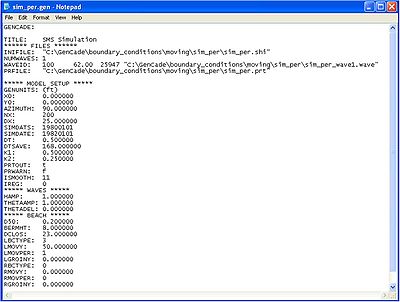
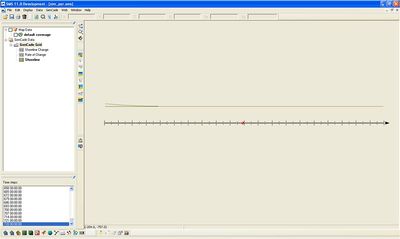
Figure 7 shows the calculated shoreline after the two year simulation. The shoreline at the left boundary has accreted 50 ft.
Displacement Per Day
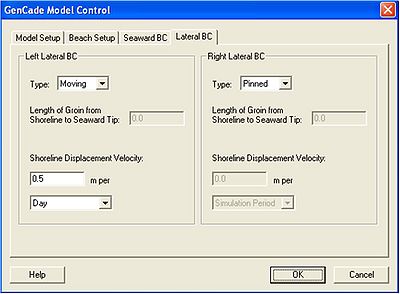
Another option for the moving boundary condition is shoreline displacement per day. In this case, the user will enter the shoreline displacement for one day in the shoreline displacement velocity blank. Generally, daily shoreline displacement should be very small. If a user mistakenly enters the shoreline displacement for the simulation instead of the daily displacement, the movement of the boundary could be very large. In Figure 8, the displacement for day is shown as 0.5 ft per day. For a three year simulation, this would result in over 1000 ft of shoreline displacement at the boundary. Please double-check to make sure the number entered for shoreline displacement corresponds to the correct time period.
A *.gen file for a simple example with a moving boundary condition (displacement for day) is shown below. This case is identical to the moving boundary condition with shoreline displacement specified per simulation except that the displacement is specified per day. In Figure 9, the *.gen file specifies LBCTYPE = 3, LMOVY = 0.5, and LMOVPER = 2.
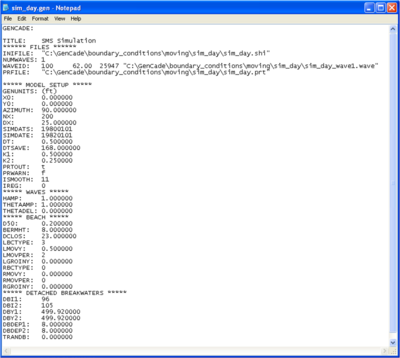
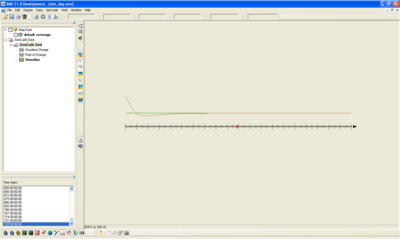
Figure 10 shows the calculated shoreline change after a two year simulation for the moving boundary condition with displacement specified per day. The shoreline at the left boundary has accreted 365.5 ft.
Displacement Per Time Step
The shoreline displacement per time step can also be entered for a moving boundary condition. In GenCade, a time step can be much less than a day (0.1 hr). Therefore, the shoreline displacement should be very small. In Figure 11, the shoreline displacement is specified as 0.5 ft per time step. In a case where the time step is defined as 0.5 hr, the shoreline will move 17,520 ft during a two year simulation.
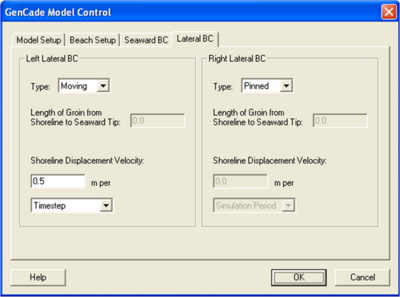
Figure 12 shows the *.gen file created by the SMS for a case with a moving boundary condition defined by displacement per time step. This case is identical to the other two moving boundary condition cases, except the displacement per time step is 0.01 (with a time step of 0.5). In this *.gen file, LBCTYPE = 3, LMOVY = 0.01, and LMOVPER = 3.
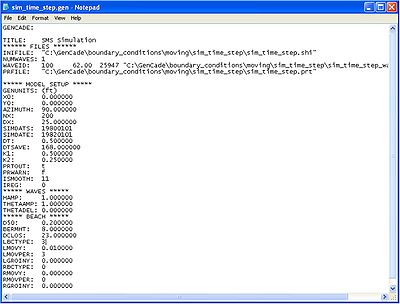
Figure 13 shows the calculated shoreline change after a two year simulation with a moving boundary of 0.01 ft per time step with a time step of 0.5 hr. The shoreline at the left boundary will move about 350 ft.
Gated
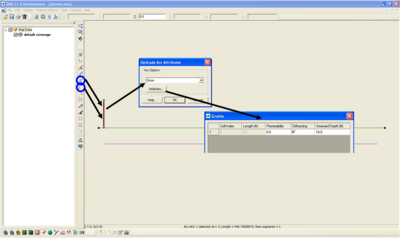
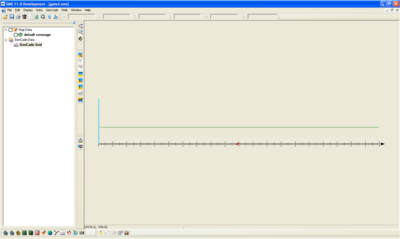
A third option is the gated boundary condition. A groin is located at the left or right boundary for a gated boundary condition. The example below is identical to the case used for the moving boundary condition except a groin is placed at the left boundary. In order to run the simulation with a gated boundary condition, it is necessary to create the groin in the conceptual model. For this case, the groin is 500 ft long. The permeability is 0, the groin is diffracting, and the seaward depth is 10 ft. Once the conceptual model is converted to a 1D grid, the groin must be located at cell 1, or the simulation will not start.
Under the Lateral BC tab in GenCade Model Control, select Gated under type. After Gated is selected as Type, the Length of Groin from Shoreline to Seaward Tip becomes activated. For this particular example, this value is 500 ft.
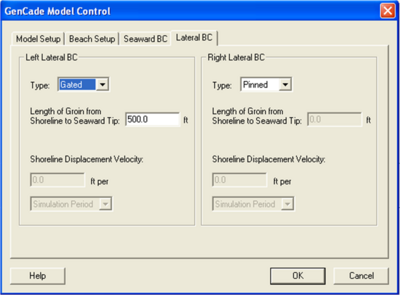
The *.gen file for the gated boundary condition is shown in Figure 16. An LBCTYPE value of 1 refers to a gated boundary condition. Since the shoreline will not move at a specified rate, LMOVY is 0. LMOVPER is 1 for a gated boundary condition. The value entered for the Length of Groin from Shoreline to Seaward Tip is represented as LGROINY. The information for the groin at the boundary condition is listed under "GROINS" in the *.gen file.
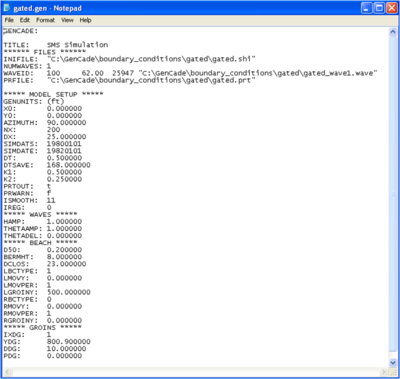
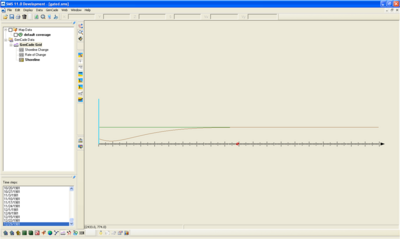
Figure 17 shows the calculated shoreline after the two year simulation. The shoreline has eroded over 200 ft at the groin (left boundary).
Return to GenCade Main Page.