Grays Harbor
Purpose
The CMS performance in simulating the hydrodynamics and wave transformation at a relatively large and complex inlet and estuary at Grays Harbor, WA is analyzed using field measurements of water levels and current velocities. The specific model features to be tested are the wave-flow coupling, user-defined water level boundary condition, and wetting and drying.
Field Study
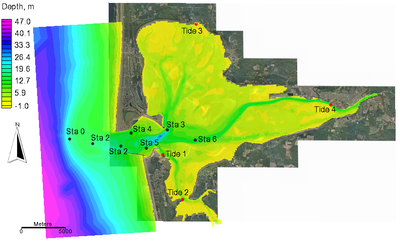
Grays Harbor is located on the southwest Washington coast about 45 miles north of the Columbia River. The estuary has a wetted surface area of approximately 91 square miles at mean higher high water and 28 squares miles at mean lower low water. The main input of fresh water is from the Chehalis River. The 3-mile wide entrance has two convergent rock jetties which extend from spit points, as shown in Figure 1. In 1999 and 2001, the USACE conducted several field experiments at Grays Harbor as part of a navigation study to better understand the sediment transport and functionality of the northern jetty (Osborne et al. 2002). During 1999, measurements of water levels, current velocities, and suspended sediment were collected at seven locations (black dots in Figure 1). Here in the current velocity data collected September to October of 1999 are used for validation. For further details on the field experiment the reader is referred to Osborne et al. (2002). For water levels, NOAA tide gauge stations were used due to their distal location from the inlet entrance (red dots in Figure 1).
Model Setup
The computational grid consisted of 67,000 cells and had a non-uniform spacing from 28 to 200 m. The model domain is shown in Figure 1. Both the wave and flow models used the same grid. The spectral waves from the NOAA buoy 46029 were input at the model boundaries every 3 hr. Wind from the same buoy was included in the wave model. The hydrodynamic, sediment transport and morphologic time steps were set to 15 min. A spatially constant Manning’s roughness coefficient was calibrated as 0.018 s/m1/3 using water level measurements and was the only parameter calibrated. The hydrodynamic model was forced with water level measurements taken at Station 0. The 27-day period from September 14 to October 15 of 1999 was calculated with CMS. The model setup is summarized in Table 1. For further details on the model setup and results see Wu et al. (2010). The 27-day simulation took approximately 7 hr on a single 2.67GHz processor.

| Parameter | Value |
|---|---|
| Time step | 15 min |
| Simulation duration | 27 days |
| Ramp period | 24 hr |
| Manning’s coefficient | 0.018 1/m1/3 |
| Steering interval | 3 hr |
Results and Discussion
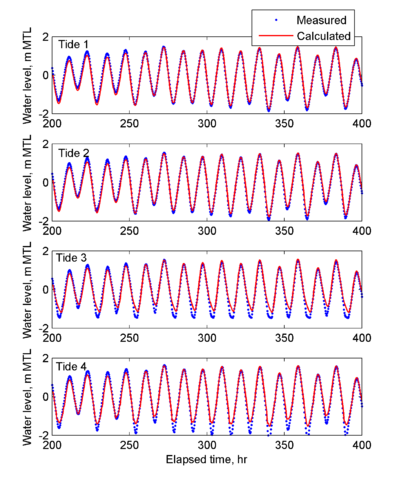
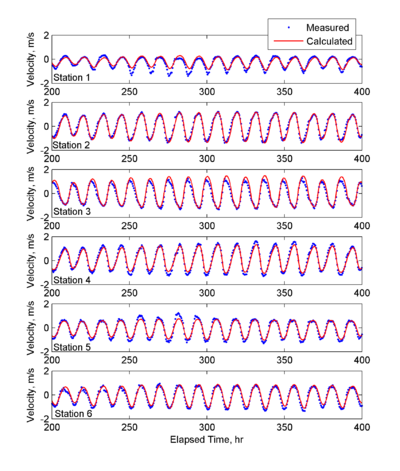
Figures 2-3 compare the computed and measured water levels and current velocities at selected stations. The agreement between calculated and measured water levels is generally good as demonstrated by the goodness-of-fit statistics presented in Table 2. There is a slight over prediction of the water level at Stations 3 and 4 during low tide and may be associated with bathymetric error or an over estimation of bottom roughness which prevents the water from ebbing during low tide. It is possible that the results may be improved by using a spatially variable bottom roughness based on the bottom and is planned for future work. Different time steps between 5-30 min were tested and the differences were negligible. The only areas which show significant differences are those with extensive wetting and drying. However, these areas contain a relatively small tidal prism and do not significantly impact the dynamics near the inlet entrance. It is interesting to note from the water levels (see Figure 2) that the hydrodynamics took approximately 250 hr to eliminate the effect of the initial condition. This suggests that the model needs a spin-up period of approximately 11 days possibly due to the presence of resonance inside bay which takes time for the model to build up.

| Statistic | Sta1 | Sta2 | Sta3 | Sta4 |
|---|---|---|---|---|
| NRMSE, % | 2.61 | 2.87 | 7.17 | 5.14 |
| NMAE, % | 2.03 | 2.41 | 5.38 | 3.78 |
| R2 | 0.990 | 0.991 | 0.968 | 0.979 |
| Bias, m | -0.017 | -0.049 | -0.132 | -0.106 |
Measured (estimated from vertical velocity profile) and calculated depth-averaged current velocities are compared along the current principle axis because it represents the major component of the current velocity variance. Peak ebb and flood current velocities ranges from approximately 1-1.5 m/s. In general, the model predicts well the amplitude and phase of the principle current velocities well. Normalized errors for the principle current velocities are less than 10% indicating a good model performance (see Table 3).

| Statistic | Sta 1 | Sta 2 | Sta 3 | Sta 4 | Sta 5 | Sta 6 |
|---|---|---|---|---|---|---|
| NRMSE, % | 10.09 | 6.74 | 8.15 | 6.13 | 6.14 | 7.33 |
| NMAE, % | 8.53 | 5.11 | 5.93 | 5.04 | 4.74 | 6.08 |
| R2 | 0.916 | 0.970 | 0.979 | 0.981 | 0.974 | 0.9702 |
| Bias, m/s | 0.053 | -0.041 | 0.123 | -0.027 | 0.0244 | 0.0816 |
As stated in Chapter 1, validation is the process of determining whether the governing equations represent the physics of the specific problem studied. When a single time-series measurement is used for calibration, the comparison between measured and computed values cannot be considered validation. However, if a model is reasonably calibrated using several measurement locations and variables such as water levels, velocities, fluxes, etc, than it arguable that the calibration results also serve to demonstrate the model validity since it would be highly improbable if not impossible to obtain a good agreement at several locations for all variables without the model accurately representing the physics of the problem being studied. A reasonable calibration is one which uses few calibration parameters and uses parameters within physically meaningful or previously reported limits. Rigorous validation requires that the calibration dataset be separate and independent of the calibration dataset. However, in coastal hydrodynamics, this can be difficult due to limited data and the fact that different study periods may have significantly different geometries due to changing bathymetry and physics (tidal vs wind- and wave-induced currents, stratified vs non-stratified, time varying bed composition and friction, exposed vs unexposed hard bottom, etc.).
Conclusions and Recommendations
The CMS performance in simulating tidal hydrodynamics at a coastal inlet in the presence of wave and wind was tested for Grays Harbor, WA using field measurements of water levels and current velocities. Water levels and depth-averaged principle current velocities were compared at several stations and four goodness-of-fit statistics were used to assess the model performance. In general, the model results agree well with measurements. Although the model ramp period was only 24 hr, the time period for the model hydrodynamics to reach dynamic equilibrium in the bay (i.e. to fully spin-up) was approximately 250 hr. The model results demonstrate that it is reasonable to use large time steps on the order of 15 min for similar tidal inlet hydrodynamic studies. Using such a large time step will however, reduce the accuracy of the wetting and drying. If this is considered to be an important aspect of the study, than a smaller time step may be more adequate.
References
- Osborne, P.D., Herricks, D.B., and Kraus, N.C., and Parry, R. M. (2002). “Wide-Area Measurements of Sediment Transport at a Large Inlet, Grays Harbor, WA,” Proceedings 28th Coastal Engineering Conference, World Scientific, 3053-3064.
- Wu, W., Sánchez, A., and Zhang, M. (2011a). "An Implicit 2-D Depth-Averaged Finite-Volume Model of Flow and Sediment Transport in Coastal Waters", ICCE 2010.