Humboldt Bay
Salinity Modeling at Humboldt Bay, CA
Introduction
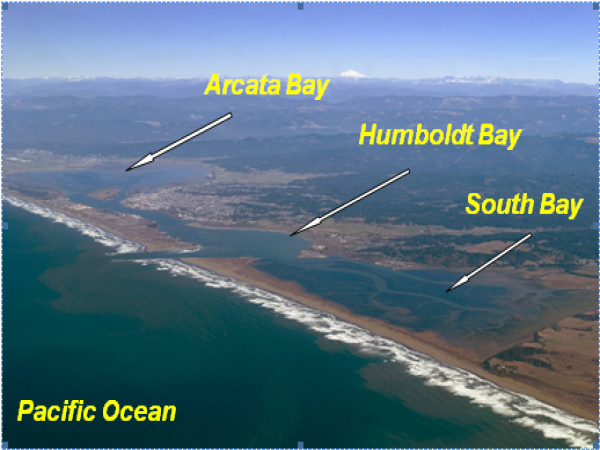
In this section, the salinity modeling is described to demonstrate the CMS capability at Humboldt Bay, CA.
Humboldt Bay is a natural multi-basin, bar-built, coastal lagoon located along the rugged North Coast of California. The bay entrance is protected by dual rubble-mound jetties from the high-energy waves at the Northeast Pacific coast (Figure 1). Wave-induced long-shore current, nearshore wave breaking, and wave-dependent mixing have a significant contribution to momentum transfer in the water column, diffusive process and spatial distributions of salinity (Moon 2005). Tides and wind are the primary forcing to drive hydrodynamics and salinity transport inside the bay.
In application of the CMS to Humboldt Bay, a quadtree grid system was developed to discretize the bay and the offshore. The computational domain extends approximately 25 km alongshore and 20 km offshore, and the seaward boundary of the domain reaches to the 300 m isobath. Figure 2 shows the quadtree grid with 43,000 ocean cells and bathymetric features of Humboldt Bay, and adjoining nearshore and continental shelf. The CMS grid permits fine resolution in areas of high interest such as jetties, channels, and the bay. The implicit solver of the CMS with a large time step of 10 minutes was employed for the simulation. The implicit version of CMS typically reduces the computation time by more than 50% as compared ot the explicit version.
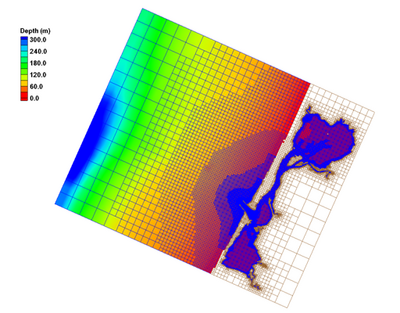
CMS-Flow is driven by time-dependent water surface elevation at the offshore open boundaries, wind forcing over the surface boundary, and freshwater inflows from rivers and tributaries. Time varying salinity values are specified along the open boundaries and with the freshwater inflows. The initial salinity field needs to be specified to the entire CMS domain as well.
1. CMS-Flow setup

The CMS hydrodynamic input files for Humboldt Bay, CA are required to be generated and prepared by the SMS shown in Figure 3. After opening “HB_Flow.cmcards” in the SMS, choose CMS-Flow | Model Control, click on the Salinity, and select the Calculate salinity (Figure 4). A time step of greater than (integer multiplier) or equal to the hydrodynamic time step should be specified. In this case, the Transport rate under the Time steps is set to 600 sec (equal to the hydrodynamic time step) for the salinity calculation.
2. Salinity initial condition
Because of the large salinity range in a coastal system, it usually requires long spin-up periods for a salinity simulation to reach to the present salinity distribution, which could range from a few days to weeks. To shorten the spin-up time, an accurate initial condition for the salinity field should be specified. There are two options to assign the initial salinity condition in CMS-Flow:
i) A global initial salinity
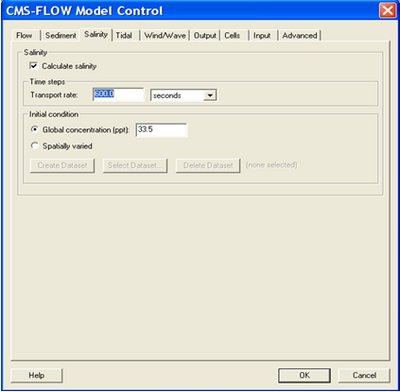
Specify a constant initial value for the entire model domain. Figure 4 shows the example of using a constant 33.5 ppt as the global initial salinity value for the Humboldt Bay model.
ii) Spatially varying initial salinity
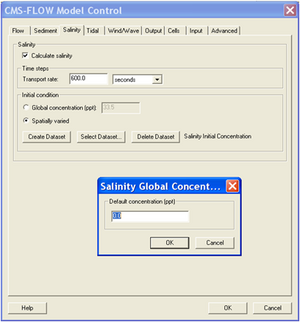
Generate a spatially varying initial salinity field by choosing the Spatially varied toggle under the Initial condition (Figure 5). Clicking the Create Dataset and assigning a value under the Default concentration (ppt) in the pop-up window will generate a new dataset with a constant initial salinity value. Clicking OK to close this window and then clicking OK to close the CMS-FLOW Model Control window, the dataset, Salinity Initial Concentration, will appear in the CMS-Flow data tree as shown in Figure 6a. Highlight the dataset to specify different salinity values in the CMS domain in the same way to modify other datasets such as D50 or Hard Bottom.
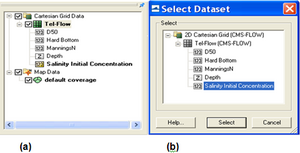
The dataset for a spatially varying initial salinity can also be generated by using Data Calculator tool in the Data menu (Demirbilek et al. 2008). For an existing dataset, click the Select Dataset under the Spatially varied and then select the dataset for the initial salinity that already exists (Figure 6b).
3. Salinity boundary conditions

Salinity conditions need to be specified at CMS-Flow boundaries. Two salinity boundary types are available in the CMS: water surface elevation (WSE) boundary (WSE-forcing boundary) and freshwater inflow boundary (Flow rate-forcing boundary) (Figure 7).
i) WSE-forcing boundary

Using the Select Cellstring tool and clicking/highlighting, the cellstring of water surface elevation boundary can be specified as shown in Figure 7a. Selecting CMS-Flow | Assign BC will open the CMS-Flow Boundary Conditions window (Figure 8). A time series of salinity can be assigned along the WSE-Forcing boundary by clicking the Curve undefined under Salinity on the left hand side of the dialog.
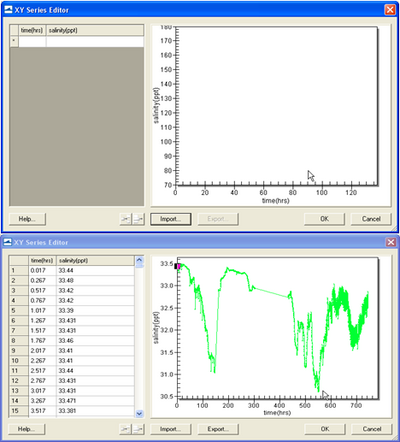
The time series is specified either by clicking the Import button to read a salinity boundary input file in xys format (Figure 9) (Aquaveo 2010) or by manually entering time and salinity values in two separate data columns or by importing salinity data from an opened Excel file by Copy/Paste.
Because the WSE-forcing boundary of the Humboldt Bay grid is located outside the bay in open coast, salinity measurements at Trinidad Bay, approximately 18 km north of the CMS domain by CeNCOOS at Humboldt State University (2010), were assigned to the CMS-Flow open boundary. A 30-day time series of the salinity data is shown for the WSE-forcing boundary in Figure 8. Salinity at this location varies between 30.5 and 33.5 ppt that show apparent influence of the ocean on salinity variations during the period.
ii) Flow rate-forcing boundary
Following the same steps as specifying WSE-forcing boundary, salinity values at freshwater inflow boundaries can be assigned together with flow specifications.
Only a few rivers and creeks flow into Humboldt Bay and no stream measurements are available. Although small, there are seasonal variations in freshwater inflows to the bay. Relatively large amount of land runoffs flows into the bay during the rainy season in northern California from October to April. For demonstration purpose in this CMS application, 10 ppt was assigned for a constant river flow in the Elk River (Figure 7). A non-zero salinity value is given here considering that the location of the Flow rate-forcing cellstring is within the intertidal zone.
Simulation Results

For the Humboldt Bay demonstration, the CMS-Flow simulation was conducted for a 30 day winter period (December 2007). Depth-averaged current and salinity fields near the bay entrance channel were retrieved from two snapshots of the CMS results at Day 19 of the simulation, corresponding to the flood and ebb currents, respectively (Figure 10).
The current speed is between 1 and 2 m/sec at the Humboldt Bay entrance during the flood and ebb tides. The bay is dominated by relatively high salinity water and low salinity water fills the downstream reach of the Elk River, consistent with the salinity specifications along the WSE-forcing and the Flow rate-forcing boundaries. Figure 10 shows that high salinity ocean water is brought into the bay by the flood current. A salt front near the mouth of the Elk River indicates that intrusion of freshwater plume into the bay. The plume is pushed upstream of the river by strong flood current passing by to the Arcata Bay and extends further into Humboldt Bay during the ebb tidal cycle.
References
- CeNCOOS. 2010. Central & Northern California Ocean Observing System. http://www.cencoos.org/.
- Moon, I. 2005. Impact of a coupled ocean wave-tide-circulation system on coastal modeling. Ocean Modeling, 8: 203-236.