Profile Feature Extraction: Step 2b - Review and Re-Plot

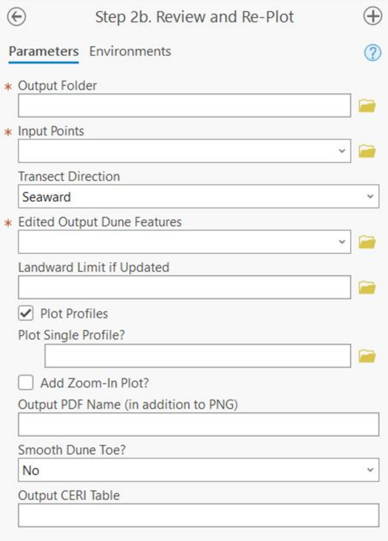
Summary: This step updates the table values of edited features and re-plots profiles. Manual editing can be done using the Arc Pro “Edit Vertices” tool to move any feature to its desired location as well as remove any superfluous or unneeded features. Once editing is complete, running this tool will update the output feature class tables, CERI tables, and plotted profiles along the whole study site or just a user-defined selection.
Output Folder: The full folder path where the profile plots should be saved. 2a plots will be overwritten if they exist in the specified folder.
Input Points: The point feature class created in step 1.
Transect Direction: Indication to the toolbox which way the transect is directed based on how it was generated. Seaward indicates a transect that extends from a landward baseline towards the sea while landward indicates a transect that extends landward from a sea baseline. Use elevation attempts to detect the direction based on the slope values around the MHW point.
Edited Output Dune Features: The edited extracted feature class. This is the same feature class created in step 2a unless a copy was created for editing.
Landward Limit if Updated: A polyline input feature that defines the landward limit location. By default, the landward limit of the profiles and CERI calculations is the baseline end of each transect.
Plot Profiles: An indicator to regenerate profile plots. If unchecked, only the feature class will be updated.
Plot Single Profile?: A single transect ID if only a single profile should be regenerated. Leave blank to regenerate all or a selected group of plots.
Add Zoom-in Plot: A check box to generate a secondary plot that extends from the landward limit to the shoreline. By default, plots are generated from the landward limit to the end of each transect. If checked, the “Zoom to Beach” option appears.
Zoom to Beach: When the “Add Zoom-in Plot” box is checked, a checkbox appears to generate an additional plot that extends from the landward limit to the dune toe.
Output PDF name (in addition to PNG): The name of the PDF file to contain all output plots, if desired. Leave blank to skip generating a PDF.
Smooth Dune Toe: A “Yes” or “No” indication to turn smoothing of the dune toe on or off. If “Yes” is selected, Filter Length and Polynomial Order fields appear.
Filter Length: An odd integer value greater than the polynomial order that specifies the cross-shore length that the profiles will be smoothed by. In combination with the polynomial order, this helps reduce noise in the input profiles when detecting profile features.
Polynomial Order: A positive integer value less than the filter length that specifies what order of polynomial best represents the input profiles. For example, a third order polynomial tends to be shaped like a single dune feature, while higher orders may represent multi-dune profiles. In combination with the filter length, this helps reduce noise in the input profiles when detecting profile features.
Output CERI Table: The name of the CERI table to be created, if desired. If the same CERI table name is specified from Step 2a, the table will be overwritten.
Best Practices & Example Data:
1. When manually editing features, display the point feature class created in step 1 and snap features to the points along the transect. This ensures that Step 2b is able to easily calculate the new elevations and cross-shore locations of the edited features. Step 2d: Edit and Plot Dune Features is an alternative to manual editing that automatically snaps the points along the transect.
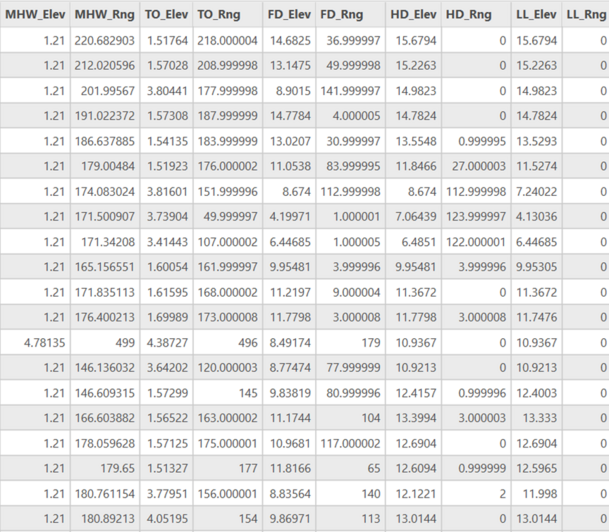
Figure 11 below displays a portion of the CERI Table that is updated during the running of this step. The elevations and ranges of features tracked in the CERI table will be updated wherever the user makes edits, and these changes will also update values such as the protective width, protective elevation, and other fields that already exist in the 2a CERI table. Additional fields are not appended at this step. Please see the appendix for definitions for all the fields created in Step 2a.
