Profile Feature Extraction: Step 4b - Create CERI Points

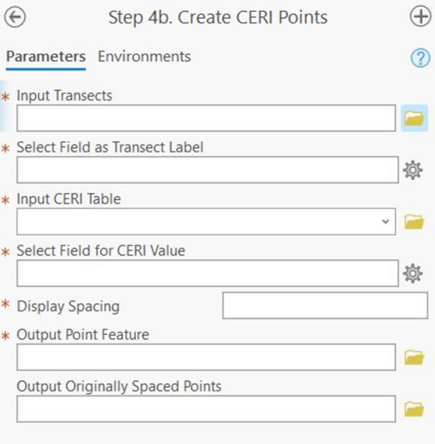
Summary: This step uses the CERI table and transects generated in previous steps and creates a CERI point feature class. One point is created for each transect and placed at start of the transect. Along with CERI values, the attribute table for this point feature class contains values for all factors and parameters used for the CERI calculation.
Input Transects: The transects generated in the previous steps.
Select Field as Transect Label: A dropdown menu to select the numbering field from the transect attribute table that provides each of the transects with a unique value (e.g., StTransNum).
Input CERI Table: The CERI table generated in previous steps.
Select Field for CERI Value: A dropdown menu to select the field from the CERI table that contains the CERI value.
Display Spacing: How often CERI points will be generated. If individual transect spacing is too dense, the user can specify an integer value here to skip that many transects before generating a point.
Output Point Feature: Full file path, including name and file extension, of the output CERI points.
Output Originally Spaced Points: The full file path, including the name and file extension, of a set of CERI points for every transect. This option is used if the Display Spacing is specified by the user but the user would also like the original tool output in addition to the spaced output.
Best Practices and Example Data:
- The field selected as the transect label should be the same field selected as the CERI value in previous steps.
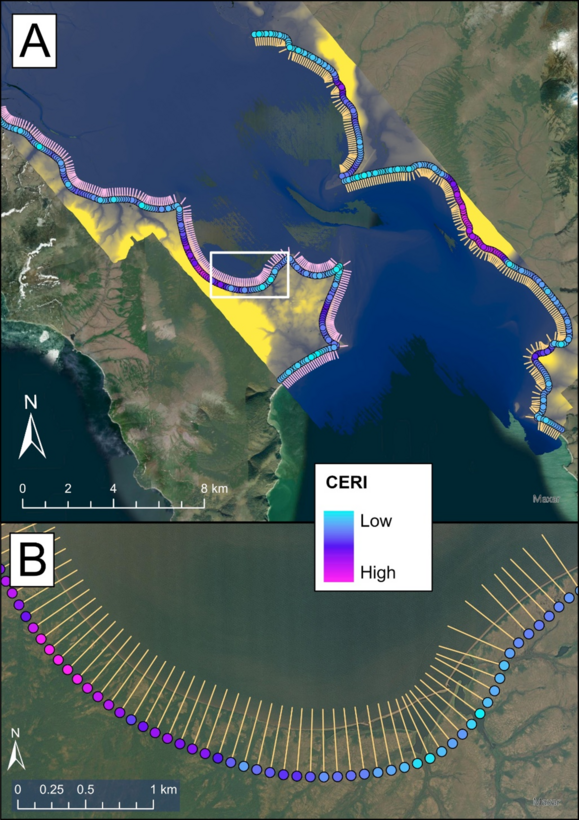
Figure 18 displays the example data output for this step, with CERI points along the landward limit of each transect. In this case the symbology is set from a “low” to “high” gradient to consider spatial trends, but individual values can also be assigned to user-defined color classes.
