Quick Response Toolbox: Step 9 - Calculate Shoreline Change

Summary: This step quantifies shoreline change between the ‘before’ and ‘after’ shorelines by quantifying the linear distance between shoreline points along each transect.
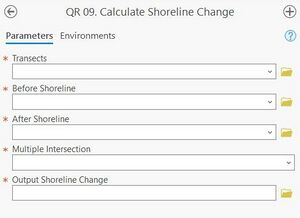
Transects: Transects created in Step 1.
Before Shoreline: Shoreline for the ‘before’ raster year created in Step 5.
After Shoreline: Shoreline for the ‘after’ raster year created in Step 5.
Multiple Intersection: In the case of a shoreline intersecting a transect at multiple locations, such as in complex areas of shoreline where high sand bars, structures, or beach shape exist at specified elevation, this selection indicates whether to keep the landward or seaward intersection.
Output Shoreline Change: Desired name and file path for the project. The output file name and location will be User-defined.
Best Practices & Example Data:
The tool cannot differentiate between previously created transect mask files and new "clean" runs. The tool also does not overwrite attributes if there is no data present. Therefore, exercise caution if bringing in transect masks or transects from past runs that have data written to them.
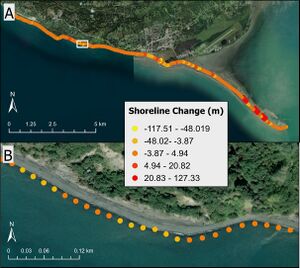
Figure 11 below displays shoreline change output for Homer, AK example data. Negative values indicate shoreline recession.
