JP-JCR-59-1
CMS-Wave: A Coastal Wave Model for Inlets and Navigation Projects
Lihwa Lin, Zeki Demirbilek2, and Hajime Mase3
ABSTRACT
The Coastal Inlets Research Program (CIRP) of the U.S. Army Engineer Research and Development Center (ERDC), Coastal and Hydraulics Laboratory (CHL), has developed a nearshore spectral wave transformation numerical model to address needs of the U.S. Army Corps of Engineers (USACE) navigation projects. The model is called CMS-Wave and is part of Coastal Modeling System (CMS) developed in the CIRP for accurate and efficient wave calculations in the vicinity of coastal and estuarine navigation channels. It can simulate important wave processes at coastal inlets including diffraction, refraction, reflection, wave breaking and dissipation mechanisms, wave-current interaction, and wave generation and growth. Recent improvements of CMS-Wave include semi-empirical estimates of wave run-up on beach face and overtopping structures, and nonlinear wave-wave interactions. It can operate on nesting grids and variable rectangular cells, run in a rapid mode, assimilate the full plane wave generation, and couple to the circulation, salinity, and sediment transport models in CMS.
CITATION
 Lin, L., Demirbilek, Z., and Mase, H. (2011). "Recent Capabilities of CMS-Wave: A Coastal Wave
 Model for Inlets and Navigation Projects,"Journal of Coastal Research Special Edition, Coastal
 Education and Research Foundation, Inc., Special Issue, No. 59, pp 7-14.
INTRODUCTION
USACE needs improved and practical wave models for calculation of wave transformation in the vicinity of coastal inlets, river entrance, harbors, and navigation channels. Wave interaction with coastal jetties, breakwaters, and revetments, including wave reflection, diffraction, transmission, and overtopping must be calculated for accurate estimations of channel infilling and potential breaching or flanking of structures. Calculations are required for wave propagation across channels and over or through structures where combined diffraction and transmission act simultaneously. Wave run-up and overtopping of structures are frequently needed. To address these needs, a spectral wave transformation model called CMS-Wave (Lin et al. 2006; Seabergh et al. 2008; Demirbilek et al. 2009) has been developed in CIRP to support the operation and maintenance of coastal inlet and navigation projects and risk analysis and reliability assessment of shipping in inlets and harbors. It is a steady-state half-plane wave transformation model means where wave energy propagation is independent of time and calculated from the offshore boundary towards the landside boundary. CMS-Wave has a backward wave marching capability for calculation of wave reflection off coastal structures and beaches.
CMS-Wave can simulate important coastal wave processes including diffraction, refraction, reflection, wave breaking and dissipation mechanisms, wave-current interaction, and wave generation and growth. The wave diffraction process is calculated in the wave-action balance equation. Other features of CMS-Wave include the grid nesting capability, variable rectangle cells, wave overtopping, wave run-up on beach face, and assimilation for full-plane wave generation. Details of the theory and numerical implementation are presented in the CMS-Wave technical report (Lin et al. 2008). Validation of the CMS-Wave run-up, transmission and overtopping structures with laboratory data, wave dissipation over muddy bed, and nonlinear wave-wave interaction features with field data are described in this paper.
WAVE-ACTION BALANCE EQUATION
CMS-Wave calculates the spectral wave transformation based on the wave-action balance equation (Lin et al. 2008):
| (1) |
where is the frequency and direction dependent wave-action density, defined as the wave energy-density divided by the intrinsic frequency ; and denote the first and second derivatives with respect to y; x and y are the horizontal coordinates; is the wave direction measured counterclockwise from the x-axis; C and are wave celerity and group velocity; , , and are the characteristic velocity with respect to x, y, and , respectively; is an empirical parameter representing the intensity of diffraction effect; and the right-hand side terms respectively are: is the source (e.g., wind input), is the sink (e.g., bottom friction, wave breaking, whitecapping, etc.), and is the nonlinear wave-wave interaction.
The first term on the right side of Equation 1 is the wave diffraction term formulated from a parabolic approximation wave theory (Mase 2001). In applications, the diffraction intensity parameter ( 0) needs to be calibrated and optimized for featured structures. The model omits the diffraction effect for = 0 and calculates the diffraction for > 0. In practice, the value of may range from 0 (no diffraction) to 4 (strong diffraction) for calculating diffraction effects. A constant value of = 2.5 has been used by Mase et al. (2001, 2005a, 2005b) to simulate wave diffraction for narrow and wide gap breakwater applications. Value of = 4 is recommnded for a semi-inifinite long breakwater or a narrow gap with the opening equal or less than one wavelength. For a relatively wider gap with the opening greater than one wavelength, = 3 is recommended. The exact value of in an application is dependent on the structure’s geometry and local bathymetry, and may need to be calibrated and verified with measurements. In CMS-Wave, the default value of = 4 is used, corresponding to strong diffraction.
Figures 1 and 2 are examples of CMS-Wave domain and calculated waves at four different locations (triangles), HMB1 to HMB4 (Osborne and Davies, 2004), at Half-Moon Bay in Grays Harbor entrance, Washington, USA. The simulation is for 10-31 December 2003 and uses input wind and wave data collected from the National Data Buoy Center (NDBC - http://www.ndbc.noaa.gov) Station 46029 and Coastal Data Information Program (http://cdip.ucsd.edu) Buoy 036 (NDBC 46211), respectively. The water level and current field input to CMS-Wave is supplied by CMS-Flow (Buttolph et al. 2006; http://cirp.usace.army.mil/products), a circulation and sediment transport model. The effect of current on waves can be seen at gauges HMB1 and HMB2 located closer to the navigation channel in relatively deep water. The effect of shallow water depth to wave diffraction, refraction, and breaking is more significant and evident in the comparison of simulation result with data for gauges HMB3 and HMB4.
WAVE RUN-UP
The wave run-up consists of two primary components: (a) rise of the mean water level by wave breaking at the shore that is known as the wave setup , and (b) swash of the incident waves. In CMS-Wave, the wave setup is computed based on the horizontal momentum equations, neglecting current, surface wind drag and bottom stresses as:
| (2) |
| (3) |
where , g, h are the water density, gravitational constant and water depth, respectively; , , are radiation stress components, obtained using linear wave theory (Dean and Dalrymple 1984) as:
| (4) |
| (5) |
| (6) |
where . The swash oscillation of incident natural waves on the beach face is a random process. In the engineering application, the 2-percent exceedance of all vertical levels is denoted as (R2). Komar (1998) has shown that the total value of on beaches, seawalls and jetties can be approximated as:
| (7) |
In CMS-Wave, is calculated based on Equation 7 at the land-water interface and averaged with the local depth to determine if water can flood the following dry cells. If the wave run-up level is higher than the adjacent land cell elevation, CMS-Wave can flood the dry cells and simulate wave overtopping and overwash at these cells.
CMS-Wave run-up is verified with the data collected from two laboratory studies of random wave up-rush on plane smooth slopes by Ahrens and Titus (1981) and by Mase and Iwagaki (1984). There are a total of 395 run-up experiments in these two studies covering a broad range of plane slope (1:1 to 1:30) and incident spectrum. Ahrens and Titus characterized the incident wave by the spectral peak frequency and a wave group parameter (Goda, 1970):
| (8) |
while Mase and Iwagaki specified the incident wave by a JONSWAP spectrum (Hasselmann et al. 1973):
| (9) |
where , are scale and shape parameters, and , are spectral peak frequency and peak-enhancement factor, respectively. Ahrens and Titus’ incident waves are converted to JONSWAP spectrum as input to CMS-Wave using the relationship of derived from Equations 8 and 9. Figure 3 shows the calculated and measured run-up . CMS-Wave tends to predict higher for steeper slope. The run-up calculations are overall in good agreement with data, with a high correlation coefficient of 0.83 between the calculated and measured (Lin et al. 2008).
WAVE TRANSMISSION AND OVERTOPPING STRUCTURES
Wave transmission over low-crest or submerged impermeable structures and breakwaters is caused by the fall of the overtopping water mass. The ratio of structure crest elevation to incident wave height is a key parameter governing the wave transmission. CMS-Wave calculates the transmission coefficient , defined as the transmitted wave height divided by the incident wave height, of a vertical breakwater based on the simple expression (Goda 2000) as:
| (10) |
where is the crest elevation of the breakwater above the still-water level ( is negative for a submerged breakwater), and is the incident wave height. For a composite breakwater, protected by a mound of armor units at its front,
| (11) |
For permeable rubble-mound breakwaters, the transmission is calculated from d’Angremond et al. (1996) formula:
| (12) |
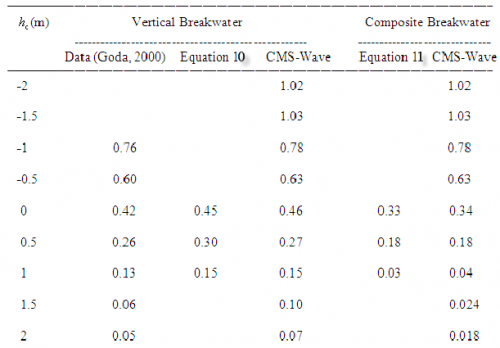
where B is the crest width, and is the Iribarren parameter defined as the fore-slope of the breakwater divided by the square-root of deepwater incident wave steepness. In practice, Equations 10 to 12 are applicable to both monochromatic and random waves. Figure 4 shows the calculated transmission coefficients and the data curves compiled by Goda (2000) for a vertical breakwater. In these simulations, CMS-Wave is forced by a monochromatic wave of 1 m and 6 sec for a vertical breakwater with h = 10 m, d = 5 m, and B = 20 m. Table 1 shows comparison of calculated transmission coefficients and laboratory data compiled by Goda (2000), and Equations 10 and 11 for monochromatic incident waves.
CMS-Wave calculates wave overtopping rate using two different methods. If CMS-Wave is run with CMS-Flow (e.g., coupled CMS run by feeding CMS-Wave radiation stresses to CMS-Flow and inputting CMS-Flow current and water levels to CMS-Wave), the overtopping rate is the flow rate calculated by CMS-Flow. Without coupling, CMS-Wave calculates the average overtopping rate based on the empirical formulation (Hughes, 2008):
| (13) |
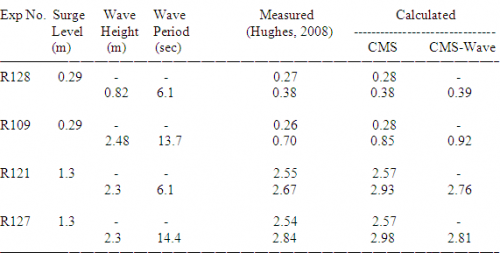
Table 2 provides comparison of the calculated average overtopping rates obtained with decoupled and coupled CMS runs for laboratory measurements of Hughes (2008) for four irregular waves and two steady storm surges overtopping a levee. In the simulation of higher surge (water level = 1.3 m) and larger waves (incident wave height = 2.3 m), the overtopping rates calculated from the CMS-Wave alone agree better with data than results from the coupled run.
NONLINEAR WAVE-WAVE INTERACTION
The nonlinear wave-wave interaction in CMS-Wave is calculated using the method of Jenkins and Phillips (2001). They proposed a simple formula to express the wave-wave interaction as a second-order diffusion operator of the isotropic form that conserves the wave energy, momentum and wave action. CMS-Wave implements this formula directly in the wave-action balance equation such that no additional integration is required to calculate the nonlinear wave interaction while the exact solution requires a computationally expensive 6-dimensional integral (Resio and Tracy, 1982). In finite water depth, the nonlinear wave-wave interaction function can be expressed as
| (14) |
where is a function of ,, and
| (15) |
Figure 5 shows the terms and as functions of , indicating that the nonlinear wave-wave interaction is more significant in the deep and intermediate water than in the shallow water. In the other words, the non-linear wave-wave interaction initially takes place in the deepwater, continue to evolve in the intermediate depth, and gradually diminish into the shallow water. The effect of interaction on wave evolution is greater over long fetches in a large ocean domain and less in a local coastal region. Figure 6 shows the comparison of directionally integrated from Equation 14 and exact computations in the examples of Hasselmann et al. (1985). These calculations are for the JONSWAP spectra with =2 and =5. Figure 7 shows the calculated nonlinear wave energy transfer rate in the frequency and direction domain for a JONSWAP spectrum with =5. The calculated results are consistent with the observed and theoretical results that the nonlinear wave-wave interaction causes the main energy to transfer from high to low frequencies.
Figures 8 shows the examples of calculated wave height field with and without nonlinear wave-wave interaction for the Louisiana coast in the north central Gulf of Mexico. The input wind and incident wave data are supplied by NDBC Buoy 42041 located approximately in the middle of offshore boundary. Figure 9 shows the corresponding wave period fields with and without the nonlinear wave energy transfer. The simulation is for the growth of an incident deepwater southeast wave of 0.3 m and 4 sec under a moderate 15-kt wind from southeast. With the nonlinear wave-wave interaction, the calculated wave height along the coast is approximately 10 percent higher than without the nonlinear energy transfer effect. The nonlinear wave-wave interaction also produces greater wave period over a larger coverage area, as a consequence of wave energy transfer from higher to lower frequencies.
The calculation of wave transformations near inlet jetties and in the wave diffraction zone can be more accurate with the nonlinear wave-wave interaction. Figure 2 shows the comparison of calculated waves with and without the nonlinear energy transfer. The calculated wave height with the nonlinear energy transfer is typically 5 percent higher than without the nonlinear energy transfer.
WAVE DISSIPATION OVER MUDDY BED
The calculation the wave dissipation over muddy bed in CMS-Wave is based on the assumption that the turbulent eddy viscosity is several orders of magnitude greater than the kinematic viscosity of sea water. By neglecting the kinematic viscous effect, the wave dissipation over a muddy bed can be expressed as (Lamb, 1932)
| (16) |
where the turbulent eddy viscosity is equal to a maximum viscosity representing the wave breaking condition times the ratio of wave height over depth.
The calculation of wave fields for the Louisiana coast in Figures 8 and 9 has involved the muddy bed effect. Figure 10 shows the location of the muddy bed area and two wave gauges, CSI3 and CSI5, installed by the Coastal Studies Institute (CSI), Louisiana State University, U.S.A. CSI3 is located in the middle of muddy bed and CSI5 is on the sandy bed (Sheremet and Stone, 2003; Sheremet et al. 2005). Figure 11 shows the comparison of calculated and measured wave heights at CSI3 and CSI5. The calculated wave height at the muddy bed CSI3 using Equation 16 clearly agrees better with the measured values as compared to without the muddy bed effect. The calculated wave height at CSI5 is practically the same with and without the muddy bed effect because it is located on the sandy bed away from the muddy area.
CONCLUSIONS
This paper provides some recent features of CMS-Wave using examples and comparison to data for wave run-up, wave transmission over and through structures, nonlinear wave-wave interaction, and energy dissipation on muddy beds. These new features implemented in CMS-Wave are essential and commonly encountered in coastal engineering applications near structures and in navigation channels, where wave-current and wave-structure interactions can be strong. Additional investigations are underway concerning contributions of wave asymmetry in shallow water, infra-gravity waves for seiching in harbors, surface roughness of breakwaters, and wave transformation over a telescope grid in coastal applications. Future companion papers in this series will address estimates of these wave processes in coastal works.
ACKNOWLEGEMENTS
The authors are grateful to Drs. Nicholas C. Kraus and Julie D. Rosati for their support and encouragement towards improving the capabilities of CMS-Wave and reliability of the model in coastal inlets and navigation applications. The authors wish to thank the Coastal Studies Institute, Louisiana State University of U.S.A., for providing directional wave and current measurements off the Louisiana coast.
LITERATURE CITED
- Ahrens, J. P. and Titus, M. F., 1981. Laboratory data report: irregular wave runup on plane smooth slopes. Coastal Engineering Research Center unpublished Laboratory Report. Vicksburg, MS: U.S. Army Engineer Waterways Experiment Station.
- Buttolph, A. M.; Reed, C. W.; Kraus, N. C.; Ono, N.; Larson, M.; Camenen, B.; Hanson, H.; Wamsley, T. and Zundel, A. K., 2006. Two-Dimensional Depth-Averaged Circulation Model CMS-M2D: Version 3.0, Report 2, Sediment Transport and Morphology Change. Coastal and Hydraulics Laboratory Technical Report ERDC/CHL-TR-06-7. Vicksburg, MS: US Army Engineer Research and Development Center.
- Dean, R. G. and Dalrymple, R. A., 1984. Water wave mechanics for engineers and scientists. Englewood Cliffs, NJ: Prentice-Hall, Inc.
- Demirbilek, Z.; Lin, L. and Seabergh, W.C., 2009. Laboratory and numerical studies of hydrodynamics near jetties. Coastal Engineering Journal 51(2):143-175 JSCE.
- d’Angremond, K.; Van der Meer, J.W. and de Jong, R.J., 1996. Wave transmission at low-crested structures. Proceedings 25th International Conference on Coastal Engineering, Orlando, FL. USA, ASCE, 2418-2427.
- Goda, Y., 1970. A synthesis of Breaker Indices. Transactions of the Japan Society of Civil Engineers 2(2):227-230.
- Goda, Y., 2000. Random seas and design of maritime structures. 2d ed. Singapore: World Scientific Publishing.
- Hasselmann, K.; Barnett, T. P.; Bouws, E.; Carlson, H.; Cartwright, D. E.; Enke, K.; Ewing, J. A.; Gienapp, H.; Hasselmann, D. E.; Kruseman, P.; Meerbrug, A.; Muller, P.; Olbers, D. J.; Richter, K.; Sell, W. and Walden, H., 1973. Measurements of wind-wave growth and swell decay during the Joint North Sea Wave Project (JONSWAP). Deutsche Hydrographische Zeitschrift A80 (12), 95 p.
- Hasselmann, S.; Hasselmann, K.; Allender, J.H. and Barnett, T.P., 1985. Computations and parameterizations of the nonlinear energy transfer in a gravity wave spectrum. Part II. Parameterizations of the nonlinear energy transfer for application in wave models. Journal of Physical Oceanography 15:1378-1391.
- Hughes, S.A., 2008 Combined Wave and Surge Overtopping of Levees: Flow Hydrodynamics and Articulated Concrete Mat Stability. Coastal and Hydraulics Laboratory Technical Report ERDC/CHL TR-08-10. Vicksburg, MS: U.S. Army Engineer Research and Development Center.
- Jenkins, A.D. and Phillips, O.M., 2001. A simple formula for nonlinear wave-wave interaction. International Journal of Offshore and Polar Engineering 11(2):81-86.
- Komar, P. D., 1998. Beach processes and sedimentation. 2nd ed. Upper Saddle River, NJ: Prentice-Hall, Inc.
- Lamb, H., 1932. Hydrodynamics. 6th ed. New York: Dover Publications.
- Lin, L.; Demirbilek, Z.; Wu., F.; Jackson, J.T. and Shak, A.T., 2006. Coastal numerical modeling of Peninsula Beach, California. Proceedings 10th Estuarine and Coastal Modeling, Newport, RI. USA, 163-185.
- Lin, L.; Demirbilek, Z.; Mase, H.; Zheng, J. and Yamada, F., 2008. CMS-Wave: a nearshore spectral wave processes model for coastal inlets and navigation projects. Coastal Inlets Research Program, Coastal and Hydraulics Laboratory Technical Report ERDC/CHL TR-08-13. Vicksburg, MS: U.S. Army Engineer Research and Development Center.
- Mase, H., 2001. Multidirectional random wave transformation model based on energy balance equation. Coastal Engineering Journal 43(4):317-337 JSCE.
- Mase, H.; Amamori, H. and Takayama, T., 2005a. Wave prediction model in wave-current coexisting field. Proceedings 12th Canadian Coastal Conference (CD-ROM).
- Mase, H. and Y. Iwagaki. 1984. Runup of random waves on gentle slopes. Proceedings 19th International Conference on Coastal Engineering, Houston, TX. USA, ASCE, 593-609.
- Mase, H.; Oki, K.; Hedges, T. S. and Li, H. J., 2005b. Extended energy-balance-equation wave model for multidirectional random wave transformation. Ocean Engineering 32(8-9):961-985.
- Osborne, P.D. and Davies, M.H., 2004. South jetty sediment processes study, Grays Harbor, Washington: Processes along Half Moon Bay, PIE Technical Report. Edmonds, WA: Pacific International Engineering.
- Resio, D. and B. Tracy., 1982. Theory and calculation of the nonlinear energy transfer between sea waves in deep water, Hydraulics Laboratory WIS Report 11. Vicksburg, MS: U.S. Army Engineer Waterways Experiment Station.
- Seabergh, W.C.; Demirbilek, Z. and Lin, L., 2008. Guidelines based on physical and numerical modeling studies for jetty spur design at coastal inlet. International Journal of Ecology and Development 11:4-19.
- Sheremet, A. and Stone, G. W., 2003. Observations of nearshore wave dissipation over muddy sea beds. Journal of Geophysical Research. 108(C11), 3357, doi:10.1029/2003JC001885.
- Sheremet, A., Meta, A.J., Liu, B. and Stone, G.W., 2005. Wave-current interaction on a muddy inner shelf during Hurricane Claudette, Estuarine, Coastal and Shelf Science. 63: 225-233.
GLOSSARY

Figure 1. CMS-Wave grid and data-collection stations at Grays Harbor, WA. USA.
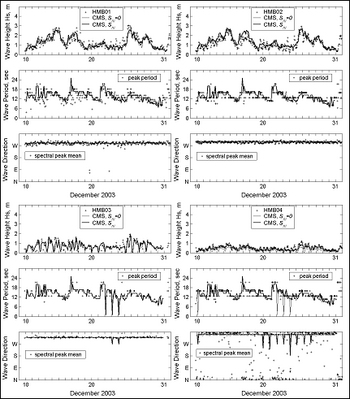
Figure 2. Measured and calculated waves at HMB1 to 4, 10-31 December 2003.
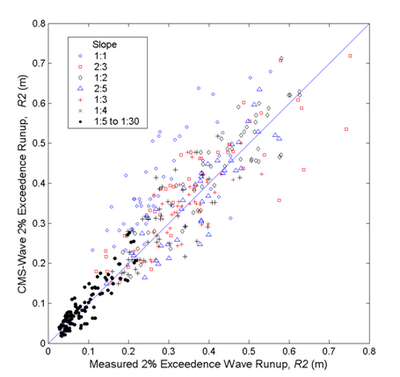
Figure 3. Measured and calculated 2% exceedence wave runup.
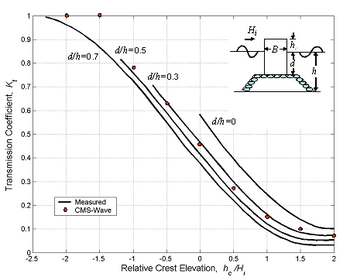
Figure 4. Measured and calculated transmission coefficients for a vertical breakwater.
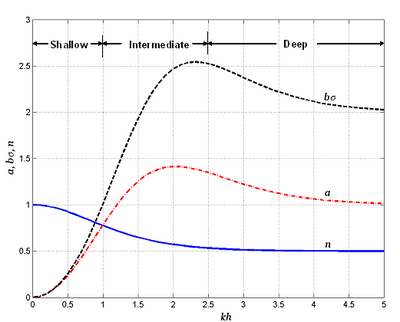
Figure 5. Nonlinear wave-wave interaction coefficients a and as functions of kh.
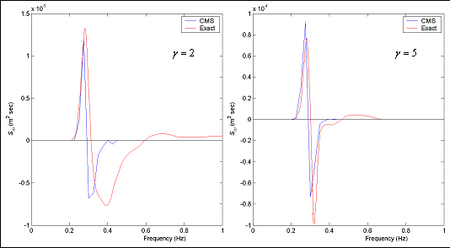
Figure 6. Comparison of directionally integrated for JONSWAP spectrum with =2 and 5.
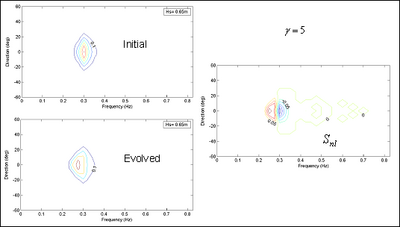
Figure 7. Calculated non-linear energy transfer for a directional JONSWAP spectrum with =5.
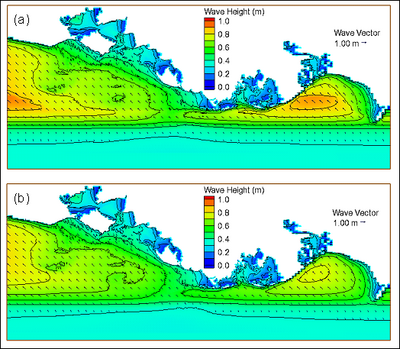
Figure 8. Calculated wave height field (a) with and (b) without non-linear wave energy transfer.
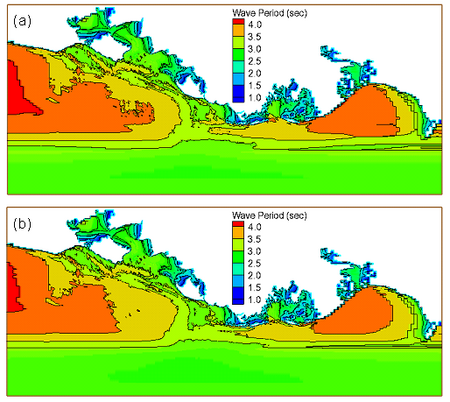
Figure 9. Calculated wave period field (a) with and (b) without non-linear wave energy transfer.
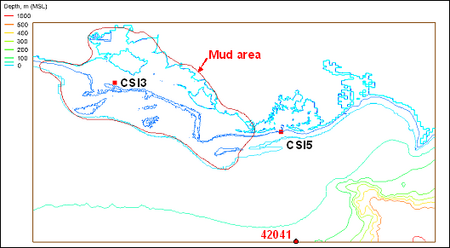
Figure 10. Location of muddy bed, NDBC 42041, and CSI wave gauges.
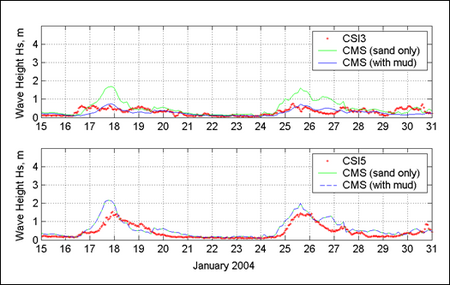
Figure 11. Measured and Calculated waves on muddy bed along Louisiana coast.
Table 1. Comparison of transmission coefficients, Kt (d/h=0.5)
Table 2. Comparison of average overtopping rate (m2/sec)
