Lab Wave Validation Case 1
Case 1: Wave shoaling and breaking around an idealized inlet
Smith et al. (1998) conducted a laboratory study to investigate the wave-current interaction and the associated wave breaking in an idealized entrance with dual jetties. Figure 1 shows the bathymetry (depth in cm) of a relatively steep beach, and the arrangement of wave and current meters. The parallel contours were determined by the equilibrium profile equation from Dean (1977) with the scale factor of 0.24 cm1/3. The slope in the model extended to 18.2 cm mean low water depth and was then linearly transitioned to the basin floor at a depth of 30.4 cm. Two parallel jetties have a spacing of 3.7 m and extend 5.5 m offshore to protect the entrance channel where the depth varied from 9 to 12.8 cm. The inlet throat converged to a depth of 15.2 cm.
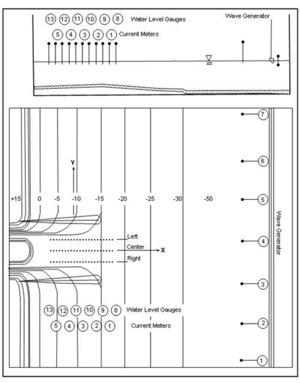
Twelve conditions, Runs 1 through 12, were conducted for a wide range of values of wave and current parameters. In the experiment, Runs 1 to 4 were without a tidal current, and Runs 5 to 8 had a moderate steady-state ebb current of approximately 11 cm/sec at the inlet entrance. Runs 9 to 12 had a strong steady-state ebb current of approximately 22 cm/sec at the entrance. All waves were generated in the basin perpendicular to the shoreline by a unidirectional plunge-type generator driven by a TMA spectral shape with gamma (spectral peak enhancement parameter) of 3.3. In Runs 5 to 12, the wave-current interaction was created between incident waves that encountered the ebb tidal current. Table 1 presents the incident wave parameters (significant height Hs defined as 4 times the total energy density, spectral peak period Tp, and spectral peak frequency fp), and ebb current condition (speed U). Wave data were collected along one transect line seaward of the wave maker and three shore-normal transect lines in the entrance channel (Figure 1).
Table 1. Incident wave parameters and current conditions.
| Run | Hs '(cm)'a | Tp '(sec)'a | fp '(Hz)'b | U '(cm/sec)'c |
| 1 | 5.59 | 1.41 | 0.71 | 0 |
| 2 | 3.70 | 1.41 | 0.71 | 0 |
| 3 | 5.15 | 0.71 | 1.41 | 0 |
| 4 | 3.71 | 0.71 | 1.41 | 0 |
| 5 | 5.77 | 1.41 | 0.71 | 11.5 |
| 6 | 4.08 | 1.41 | 0.71 | 11.7 |
| 7 | 5.30 | 0.71 | 1.41 | 11.4 |
| 8 | 3.92 | 0.71 | 1.41 | 11.1 |
| 9 | 5.97 | 1.41 | 0.71 | 21.9 |
| 10 | 4.61 | 1.41 | 0.71 | 21.8 |
| 11 | 5.51 | 0.71 | 1.41 | 21.9 |
| 12 | 4.16 | 0.71 | 1.41 | 21.5 |
| a. Data averaged over gauges in front of wave generator. b. fp = 1/Tp. c. Averaged over current meters in the entrance channel. | ||||
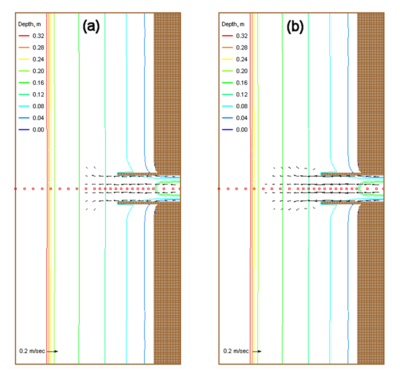
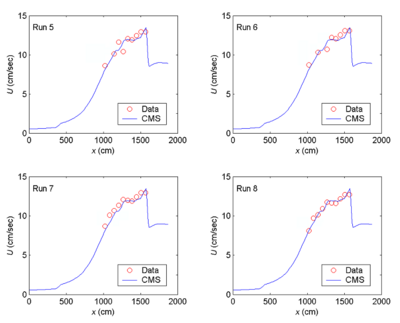
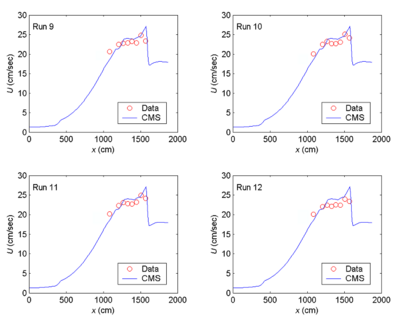
CMS-Wave simulations were run in the laboratory scale. The grid domain covered the same rectangular area as the experiment basin. It consisted of 188 cross-shore and 401 along-shore square cells, each 10 cm ×10 cm. The incident wave input at the seaward boundary was a TMA-type unidirectional spectrum consisting of 30 frequency bins (0.5 to 3 Hz at 0.085-Hz increment) and 35 direction bins (covering a half-plane with 5-deg spacing). The 2D background input current fields for Runs 5-8 and 9-12 were prepared using the CMS-Flow, drives by different water levels specified at the inlet throat and sea boundaries. A water level difference of 3 cm was specified in the CMS-Flow to simulate a weak current field for Runs 5-8. A water level difference of 5 cm was specified in the CMS-Flow to generate a stronger current field for Runs 9-12. Figure 2 shows calculated ebb current fields in the steady-state condition. Both depth contours and current vector fields are symmetric with respect to the inlet channel center line in the model. Figures 3 and 4 show the measured and calculated current speeds along the inlet channel centerline. To test each of four wave breaking formulas described in Chapter 2, CMS-Wave was run in the basic mode (iwet = 0, ibf = 0, iark = 0, iarkr = 0, and akap = 1). For each run, the wave data collected in front of the wave generator was averaged and input as the incident wave condition.
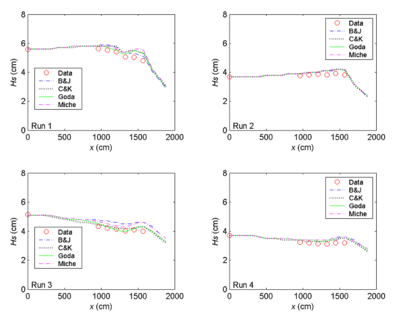
Figures 5 to 7 compare measured and calculated wave heights along the entrance channel centerline for the null ebb current, moderate ebb current, and strong ebb current, respectively. For the null ebb current (Runs 1-4), the calculated wave height agrees well with measurements for all four wave breaking formulas. The extended Goda formula appears to agree slightly better with the measurements than the other three formulas; this is especially true for larger incident wave height (Runs 1 and 3) in the null tidal current condition. The performance of individual breaking formulas becomes different for shorter incident wave period irrespective of the incident wave height in these runs. This is evident in Figures 5 to 7 (Runs 3, 4, 7, 8, 11, and 12).
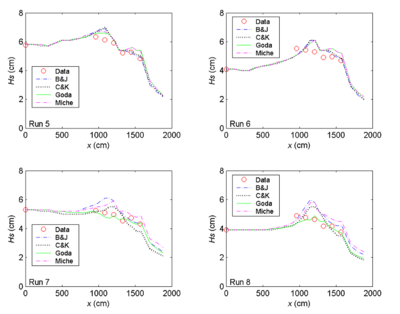
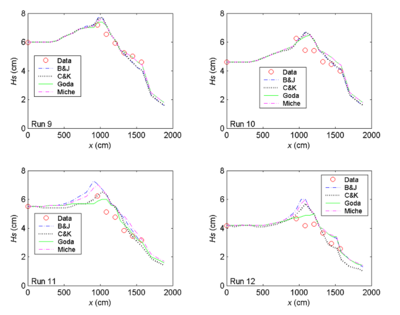
With an ebb current present (Runs 5-12), the calculated wave height overall agrees better with the measurements for the incident wave of longer period (1.41 sec). This observation holds true regardless of large or small wave height and current magnitude, as shown in the upper panel in Figures 15 and 16 (Runs 5, 6, 9 and 10). For the shorter wave period (0.71 sec), the breaking formula by Battjes and Janssen (1978) and the Extended Miche formula (Battjes 1972; Mase et al. 2005b) tend to overestimate the wave height, whereas the formula by Chawla and Kirby (2002) and the Extended Goda formula (Sakai et al. 1989) compare better for wave height. The overall performance of these breaking formulas revealed that wave height estimates based on the Extended Goda formula, with or without the wave-current interaction, were consistently better than estimates obtained with the other formulas.