Lab Wave Validation Case 3
Case 3: Wave runup on impermeable uniform slope
Wave runup on a uniform slope calculated by CMS-Wave was compared to two laboratory experiments, one experiment conducted by Ahrens and Titus (1981) the other by Mase and Iwagaki (1984). Incident random waves were generated in both experiments in a wave flume consisting of a flat bottom connected to a slope. The experiments by Ahrens and Titus included 275 wave conditions (Ahrens and Heimbaugh 1988), with the significant wave heights ranging from 4 to 20 cm and spectral peak periods from 1.1 to 4.5 sec, on six different uniform slopes at 1:1, 2:3, 1:2, 2:5, 1:3, and 1:4. The experiments by Mase and Iwagaki tested 120 wave conditions (Mase 1989), with significant wave heights ranging from 2.7 to 11 cm and spectral peak periods from 0.8 to 2.5 sec, on four uniform slopes at 1:5, 1:10, 1:20, and 1:30.
CMS-Wave was run at the laboratory scale. The model grid consisted of 1,750 cross-shore and 100 alongshore square cells, each 2 cm × 2 cm, to cover a 10-m-long flat bottom and a 25-m-long slope section. The spectral transformation was computed in CMS-Wave on 30 frequency bins (from 0.1 to 1.26 Hz at 0.04-Hz increment for the Ahrens and Titus experiments, and from 0.02 to 2.05 Hz at 0.07-Hz increment for the Mase and Iwagaki experiments) and 35 direction bins (covering a half-plane with 5-deg spacing). Bottom friction was neglected (cf = 0) in the numerical simulations.
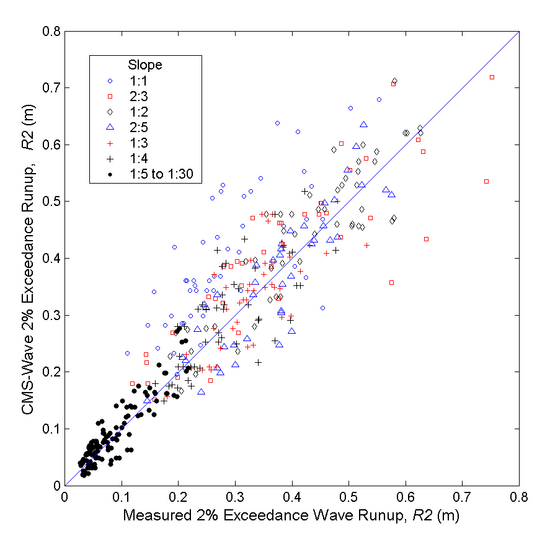
Figure 1 shows the measured and calculated 2% exceedance wave runup (R2) for all experiments conducted by Ahrens and Titus (1981) and by Mase and Iwagaki (1984). Table 1 presents the mean bias (mean of calculated minus measured) and correlation coefficients (equivalent to normalized root-mean-square errors) between the measured and calculated 2% exceedance wave runups. The CMS-Wave calculated 2 % exceedance wave runups correlate well with the measured values for all test slopes, especially for more gentle slopes (1:5 to 1:30). The mean bias of calculated runups is generally small in all cases except for the steepest slope (1:1) condition in which CMS-Wave tends to overestimate the runup (open-circles in Figure 1). For steeper slopes, more wave reflection with less wave energy loss on the slope can affect the wave runup calculations. Testing of the wave reflection effect on wave runup for a steep slope is underway.

| Slope | Mean of Calculated '''R'''2 (m) | Mean of Measured '''R'''2 | Mean Bias (m) | Correlation Coefficient |
| 1:1 | 0.40 | 0.29 | 0.11 | 0.74 |
| 2:3 | 0.41 | 0.39 | 0.02 | 0.86 |
| 1:2 | 0.44 | 0.43 | 0.01 | 0.90 |
| 2:5 | 0.37 | 0.37 | 0.00 | 0.88 |
| 1:3 | 0.33 | 0.33 | 0.00 | 0.79 |
| 1:4 | 0.29 | 0.28 | 0.01 | 0.72 |
| 1:5 - 1:30 | 0.09 | 0.09 | 0.00 | 0.91
|
Table 1. Statistics of measured and calculated wave runup.