Long-wave Frictionless
Test C1-Ex5: Long-wave Runup over a Frictionless Slope
Purpose
The performance of the CMS-Flow in calculation of nonlinear long-wave runup over a frictionless planar slope is assessed by comparing the computed water levels and shoreline position with an analytical solution presented by Carrier et al. (2003).
Initial Condition
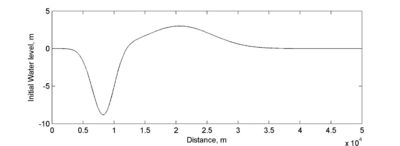
The bed has a constant slope of 1:10 with the initial shoreline located at m. Figure 13 shows the initial water level is given by a leading depression N-wave (characteristic of the waves caused by submarine landslides). The initial current velocity is equal to zero everywhere.
 Figure 13 Initial water level profile for the long-wave runup test case.
Model Setup
The computational grid has variable grid resolution of 3 m for m and increases to 10 m offshore with an aspect ratio of 1.05. The general model parameters used in the simulation are shown in Table 13. A relatively small time step of 0.1 s is required due to the moving boundary. In CMS, the computational grid is fixed and the moving wetting and drying boundary is treated as an internal boundary. In CMS, cells are judged as wet or dry (no partial wet or dry cells) based on a threshold wetting/drying depth and the interface between wet and dry cells is treated as a closed internal boundary with wall friction.
| Time step | 0.1 s |
|---|---|
| Simulation duration | 360 s |
| Ramp duration | 0.0 s |
| Wetting/drying depth | 0.01 m |
| Wall friction | Off |
| Mixing terms | Off |
| Bottom friction | Off |
Results and Discussion
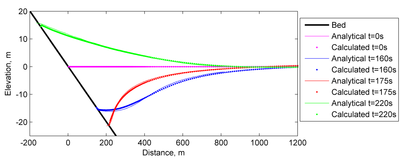
Figure 14 shows a comparison of computed and analytical water surface elevations near the shoreline at 4 different elapsed times for the first 1,200 m from the initial shoreline position. The water level variation is characterized by a leading depression wave followed by a runup event. The model performance is generally good as demonstrated by the goodness-of-fit statistics shown in Table 14.
 Figure 14. Comparison of analytical and calculated water levels at
different elapsed times for the long-wave runup test case.
| Time, s | NRMSE, % | NMAE, % | Bias, m | |
|---|---|---|---|---|
| 160 | 3.7 | 3.8 | 0.999 | -0.012 |
| 175 | 6.5 | 5.9 | 0.997 | -0.113 |
| 220 | 4.6 | 5.4 | 0.999 | -0.066 |
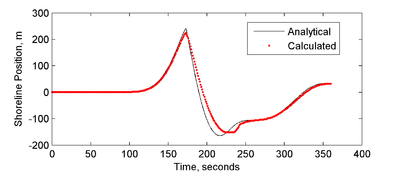
A comparison of the numerical and analytical solutions for the shoreline position is shown in Figure 15. The water shoreline position of the leading depression wave is well captured including the peak shoreline position. However the shoreline position during the inundation or advancement of the first wave is slightly under predicted. This is due to the small instability which is shown at 220 s near the shoreline position in Figure 15. The small instability is formed during the uprush of water but does not grow significantly and does not cause significant error in the computed water levels. Further tests can be done in the future to investigate if the instability can be reduced by reducing the grid spacing or time step. Once the first wave begins to recede, the calculated shoreline position again agrees well with the analytical solution. It is noted that for practical field applications, the bottom is not frictionless or inviscid, which will improve the model stability. In general, the CMS model’s wetting and drying performance is considered satisfactory for the purposes of the model. The implicit solution scheme is designed for practical applications of tidal flow and wind- and wave-induced currents. This verification test provides a good case for testing the nonlinear hydrodynamics and wetting and drying algorithm.
 Figure 15. Time series comparison of calculated and analytical
shoreline positions for the long-wave runup test case.
Conclusions and Recommendations
The CMS-Flow performance in simulating nonlinear hydrodynamics is tested using the analytical solution for long-wave runup over a planar frictionless slope presented by Carrier et al. (2003). Comparison of computed and analytical water levels and shoreline positions indicate good model performance as demonstrated by the goodness-of-fit statistics. The wetting and drying algorithm was found to be robust and led to an accurate prediction of the shoreline position.