Quarter Annulus
Test C1-Ex3: Tidal Propagation in a Quarter Annulus
Purpose
The purpose of this verification test is to assess the model performance in simulating long wave propagation. The case is useful for testing the model performance and symmetry for a non-rectangular domain with a tidal forcing specified on one of the curved boundaries. Because there is no bottom friction or mixing, the test case is also useful for looking at numerical dissipation.
Problem
Lynch and Gray (1978) presented the analytical solution for depth-averaged long-wave propagation in an annular domain. The case was for a linearly sloping bed, and without bottom friction, Coriolis force, or horizontal mixing. The offshore boundary consisted of a single tidal constituent (see Figure7). Table7 summarizes the important model settings used for this test.
| Parameter | Value |
|---|---|
| Deepwater tidal amplitude | 0.3048 m (1 ft) |
| Tidal period | 12.42 hr (M2 tide) |
| Inner radius | 60.96 km |
| Outer radius | 152.4 km |
| Inner water depth | 10.02 m |
| Outer water depth | 25.05 m |
| Bathymetry profile | Linear |
| Bottom friction | None |
| Mixing terms | Off |
| Coriolis force | Off |
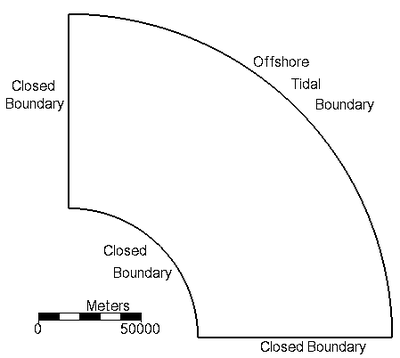 Figure 7. Computational domain for tidal propagation in a quarter
annulus.
Model Setup
The computational grid (Figure 8) consists of a three-level telescoping Cartesian grid with resolution of 4, 2, and 1 km for the three levels. Higher resolution is specified near the inner and outer boundaries in order to reduce errors associated with the representation of the curved boundaries with squares. The grid has 1,160 active ocean cells. Model settings are shown in Table 8.
| Parameter | Value |
|---|---|
| Solution scheme | Implicit |
| Time step | 10 min |
| Simulation duration | 120 hr |
| Ramp duration | 24 hr |
| Mixing terms | Off |
| Advection terms | Off |
| Wall friction | Off |
| Coriolis force | Off |
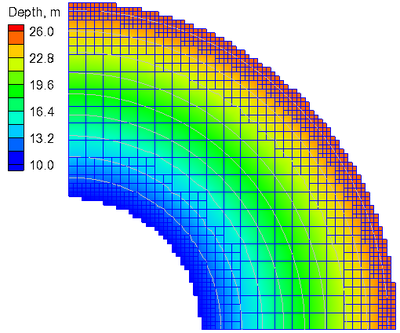 Figure 8. Computation grid used for tidal propagation in a quarter annulus.
Results and Discussion
Figure 9 shows a time series of water levels at the inner edge of the simulation domain. The goodness-of-fit statistics are listed in Table 9. The model accurately predicts the wave phase but slightly overestimates the amplitude by approximately 0.01 m. No significant numerical dissipation is observed or numerical instability. The simulation takes about 1 min on a Windows PC on a single 2.67 GHz processor.
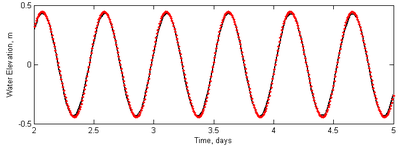 Figure 9. Comparison of analytical (solid black) and calculated (red
dots) water surface elevations at the center of the inner radius.
| Statistic | Value |
|---|---|
| NRMSE, % | 3.3 |
| NMAE, % | 2.7 |
| 0.999 | |
| Bias, m | 0.002 m |
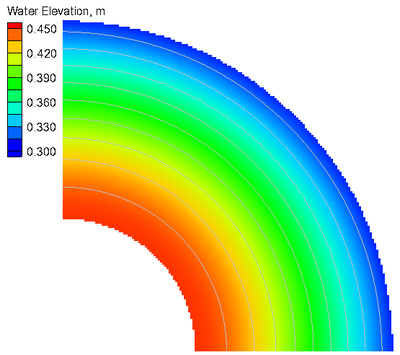
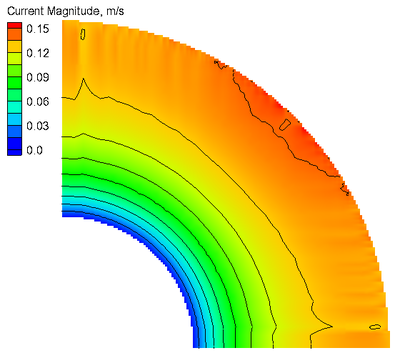
An example of the simulated water level and current velocity magnitude
fields is shown in Figure 10. The water level contours are very smooth
and do not show any significant instabilities. However, the current
magnitude shows some errors at the offshore boundary. This is due to
staircase representation of the curved open boundary. This problem
would be fixed by specifying the analytical current velocities at the
offshore boundary, but it was not done in this example. Sensitivity
tests with smaller time steps showed that the problem persists for
smaller time steps. For practical applications all model forcing is
specified on straight boundaries and this problem does not occur as
demonstrated in subsequent test cases.
Figure 10. Snap shot of water levels at 62 hr (a) and current magnitude at 65.5 hr (b).
Conclusions and Recommendations
The CMS-Flow can accurately simulate linear long-wave propagation in a quarter annulus with a linear bed and zero bottom friction and Coriolis. The water level NRMSE, NMAE, and R2 were 3.3%, 2.7%, and 0.999, respetively. For practical applications, it is recommended to specify water level boundary conditions on straight boundaries. If a curved forcing boundary is necessary, then it is recommended to specify both water levels and current velocities.
