Salinity Calculations in the Jupiter Inlet - Loxahatchee River System, FL
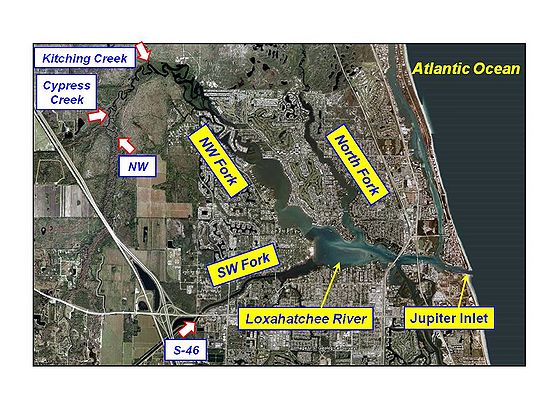
The Loxahatchee River is a 7.6-mile-long river near the southeast coast of Florida. Freshwater meanders through the river’s three main forks, the North Fork, the Northwest Fork and the Southwest Fork, into the brackish estuary and then flows out the Jupiter Inlet into the Atlantic Ocean (Figure 1). The estuary entrance is protected by dual jetties from ocean waves. Momentum transfer, diffusive process and spatial distributions of salinity in the Jupiter Inlet-Loxahatchee River system are dominated by tides, wind, and freshwater inflows.
In application of the CMS to the Loxahatchee River, a quadtree grid system was developed to discretize the bay and the offshore. The computational domain extends approximately 11.0 km alongshore and 4.5 km offshore, and the seaward boundary of the domain reaches to the 20 m isobath. Figure 2 shows the quadtree grid with 50,000 ocean cells and bathymetric features of the Jupiter Inlet-Loxahatchee River system, and adjoining nearshore area. The CMS grid permits fine resolution in areas of high interest such as jetties, channels, the bay, and the river. The implicit solver of the CMS with a large time step of 10 minutes was employed for the simulation. Comparing to the explicit solver for a similar model, the computation time was reduced by more than 50%.
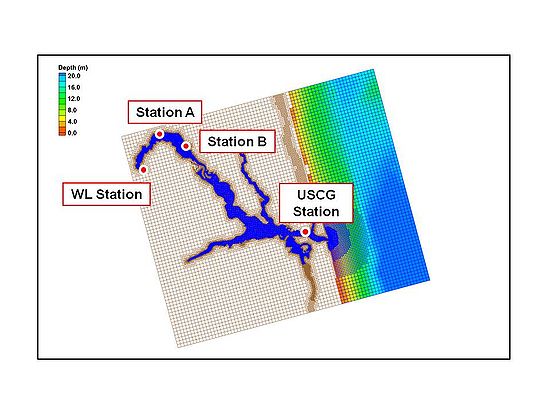
River and estuarine survey data were obtained from U. S. Geological Survey (USGS), the Loxahatchee River District (LRD), and U. S. Coastal Guard (USCG). Arrows and red dots in Figures 1 and 2 indicate the station locations where freshwater inflows, water surface elevation, and salinity data were collected. Daily freshwater flows are available at four USGS gages, Lainhart Dam (NW), Cypress Creek, Kitching Creek, and S-46. USGS also monitors tide and salinity at the Trapper Nelson’s Interpretive Site (WL Station) and Boy Scout Camp dock (Station B). Salinity data near the mouth of Kitching Creek (Station A) were collected by the LRD. Both salinity and tide were measured near the Jupiter Inlet at the USCG Station.
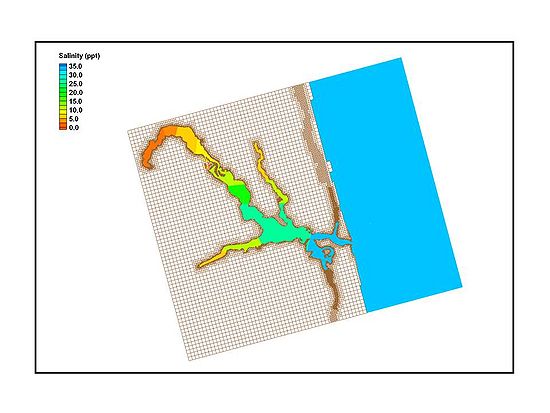
CMS-Flow is driven by time-dependent water surface elevation at the offshore and intracoastal open boundaries, wind forcing over the surface boundary, and freshwater inflows from rivers and tributaries. Time varying salinity values are specified along the open boundaries and the river boundaries with the freshwater inflows (Figure 1). Based on the historical survey data, initial salinity is specified for the Jupiter Inlet-Loxahatchee River system. The salinity varies from 1.0 ppt at the upstream of the river to 32.0 ppt at the offshore and intracoastal open boundaries (Figure 3).
For the Jupiter Inlet - Loxahatchee River system, the CMS-Flow simulation was conducted for December 2002. Depth-averaged current and salinity fields in the estuary and river were retrieved from two snapshots of the CMS results, corresponding to the flood and ebb currents, respectively (Figure 4).
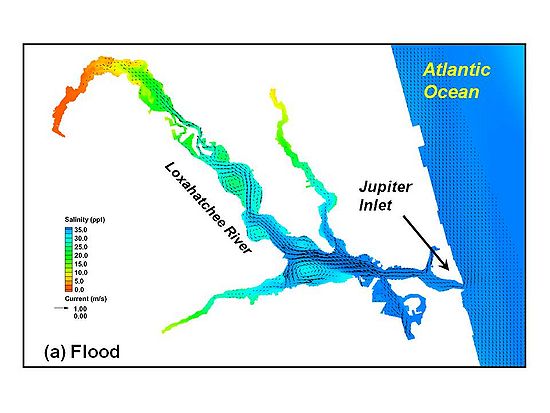
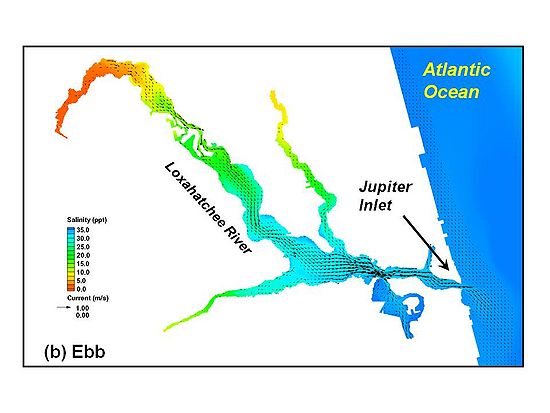
The current speed is more than 1.0 m/sec at the embayment during the flood and ebb tides. The downstream reach of the Loxahatchee River is dominated by relatively high salinity ocean water during the flood tide (> 34.0 ppt) and low salinity water fills the bay during the ebb tide (< 28.0 ppt). A salt front in the NW Fork of the river indicates that the interaction between freshwater plume and ocean water intrusion. The front can be pushed upstream of the NW Fork by strong flood current passing by to Boy Scout Camp dock and retreats into the embayment during the ebb tidal cycle.
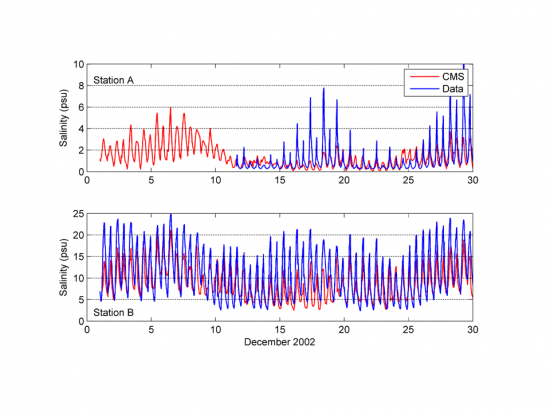
Model configuration and model performance were examined by comparing the measured and computed water surface elevations at the Trapper Nelson’s Interpretive Site. Salinity calculations in the system were validated by the data collected at Stations A and B.
Water surface elevation comparisons are shown in Figure 5. The calculated tide at this upstream river location has a good agreement with the measurements both in amplitude and phase. The correlation coefficient between the CMS and the data is 0.83 and the root mean square error (RMSE) is 0.15 m.
Figure 6 shows the salinity comparisons at Stations A and B. Significant salt intrusion by the flood tide can be seen at both locations. Salinity at Station B shows a much large variability, from below 5 up to 25 ppt during this simulation period. To avoid the sensor exposure to air, salinity data at each monitoring station were collected at a water depth below the local mean lower low water (SFWMD 2005), which partially explains the discrepancy of salinity ranges between the data and the depth-averaged CMS results. In addition, insufficient representation of freshwater inflows, such as tributaries, surface runoffs, and groundwater, in the CMS could also result in smaller salinity variations. Correlation coefficients between the CMS and the data are 0.69 and 0.80, the root mean square errors (RMSE) are 1.11 and 4.00 ppt, and the relative RMSEs, RMSE/salinity range, are 11 and 16%, respectively at Stations A and B.
References
Li, H., C. W. Reed, G. A. Zarillo, and M. E. Brown. 2010. Salinity Calculations in the Coastal Modeling System. Coastal and Hydraulics Engineering Technical Note ERDC/CHL CHETN-XX-XX. Vicksburg, MS: U.S. Army Engineer Research and Development Center.
SFWMD. 2005. Evaluation of Restoration Plan Alternatives for the Northwest Fork of the Loxahatchee River. South Florida Water Management District, Water Supply Department.