User Guide 010
Initial Condition
The salinity initial condition is specified from within the Salinity tab of the CMS-Flow Model Control window (see Figure 2 74. Two options are available for the initial condition: (1) a constant value, or (2) a user-specified dataset. The CMS card used to specify the salinity initial condition is described in Table 2-68.
Table 2-66. CMS card used to specify the salinity initial condition
| Input | Format | Notes |
|---|---|---|
| Salinity
Initial Condition Constant |
[card=SALINITY_IC_CONSTANT]
[name=SalIC, type=char, options=(ON,OFF), default=OFF] |
Specifies the salinity initiation condition as a constant value for the whole solution domain. |
| Salinity
Initial Condition Dataset |
[card=SALINITY_IC_DATASE]
[name=SalICfile, type=char, default=none] [name=SalICpath, type=char, default=none] |
Specifies the salinity initiation condition dataset file and path. |
Note:
- • For some applications, using a constant value for the initial condition may be lead to a long spin-up time for salinity. The spin-up time is the time it takes for the salinity to reach a quasi equilibrium or in other words the time it takes for the effects of the initial condition to disap-pear. A better approach is to use a spatially-varying user-specified da-taset. The dataset may be obtained from a previous simulation or manually created based on user judgment.
Boundary Conditions
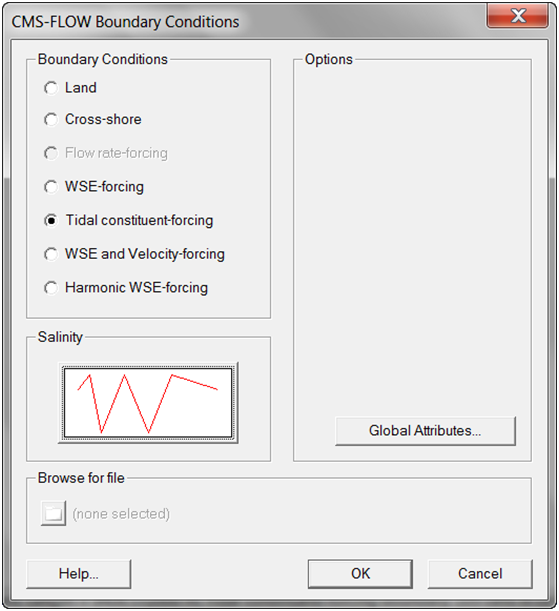
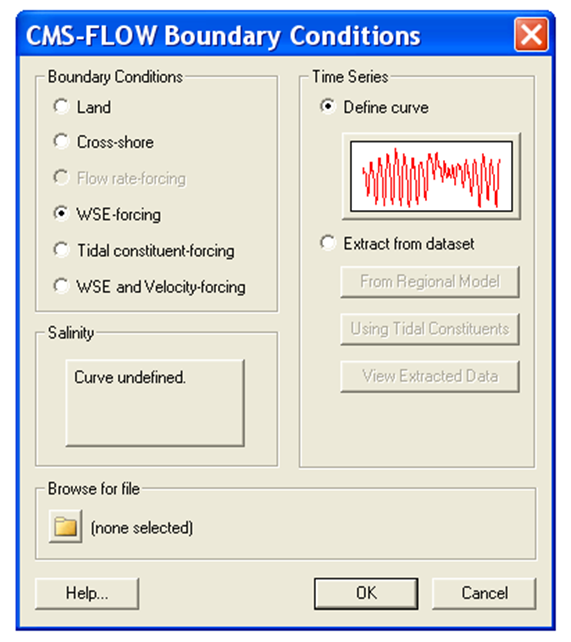
The salinity boundary conditions are setup in the CMS-Flow Boundary Conditions window (see figure below). Currently, the CMS only supports a single salinity time series boundary condition. In this boundary condition, a constant salinity is assigned along the whole boundary. The value is interpolated in time from a user specified time series. The salinity must be specified at ALL open boundary conditions. The user specified salinity is only applied for inflow conditions. When the flow is directed outward of the computational domain, a zero-gradient boundary condition is applied.
Figure 2-71. Specification of boundary salinity time-series in the CMS-Flow Boundary Conditions window.
The CMS card used to turn on or off the salinity transport is described in Table 2-68.
Table 2-67. CMS card used to turn On or Off the sediment transport
| Input | Format | Notes |
|---|---|---|
| Saliniity
Transport Activation |
[card=CALC_SALINITY_TRANSPORT]
[name=SalTrans, type=char, options=(ON,OFF), default=OFF] |
Turns on or off the salinity transport calculation. |
Notes:
- • The salinity must be specified at all open boundary conditions. In addition the input time series at each boundary must be at least as long as the simulation duration.
- • The salinity is NOT used to update the water density or viscosity during the simulation. The CMS uses a constant water density and viscosity. Therefore density gradients are ignored in the momentum equations.
- • Turning on the salinity transport increases the computational time because an additional transport equation needs to be solved.
Advanced Settings
To Be Completed
Step-By-Step Salinity Transport Application for Matagorda Bay, TX
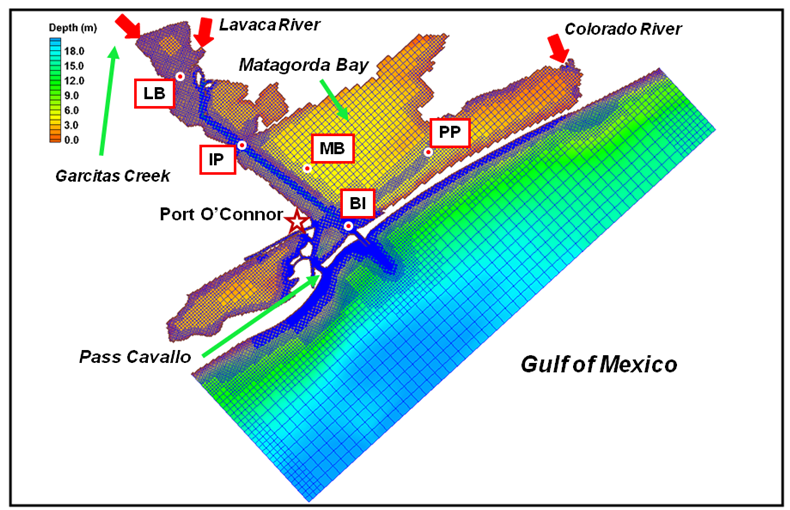
Matagorda Bay is the largest estuarine bay on the coast of Texas and is connected to the Gulf of Mexico and the Gulf Intracoastal Waterway (GIWW) through Matagorda Ship Channel (MSC), a federally-maintained inlet, and Pass Cavallo, a natural inlet just downdrift from the MSC (Figure 2=72).
Figure 2-72. CMS domain, quadtree grid, and bathymetry of Matagorda Bay, TX. Red dots are the survey stations and red arrows indicate freshwater inflow locations.
In application of the CMS to Matagorda Bay, a telescoping grid was devel-oped to discretized the bay and the offshore. The computational domain extends approximately 80 km alongshore and 20 km offshore, and the seaward boundary of the domain reaches to the 25-m isobath. Figure 2 72shows the telescoping grid with 70,000 ocean cells, bathymetric fea-tures of Matagorda Bay, and the adjoining nearshore area. The CMS grid permits fine resolution in areas of high interest such as jetties and chan-nels. The implicit solver of the CMS, with a large time step of 15 minutes, was employed for the simulation.
Freshwater discharges into the bay come from a number of streams along the coast. The Colorado and the Lavaca Rivers provide most of the inflows. However, “the freshwater discharge is typically less than 10 percent of the daily tidal exchange” in the bay (Kraus et al. 2006). The bay entrance is protected by dual jetties from ocean waves. Momentum transfer, diffusive process and spatial distributions of salinity in the system are mostly controlled by wind, tide, and freshwater inflows.
CMS-Flow is driven by time-dependent water surface elevation at the off-shore open boundary, wind forcing over the air-sea interface, and freshwater inflows from rivers and tributaries. Time varying salinity values at BI are also specified along the open boundaries with the water surface elevation and the river boundaries with the freshwater inflows. The initial salinity field is specified to the entire CMS domain as well.
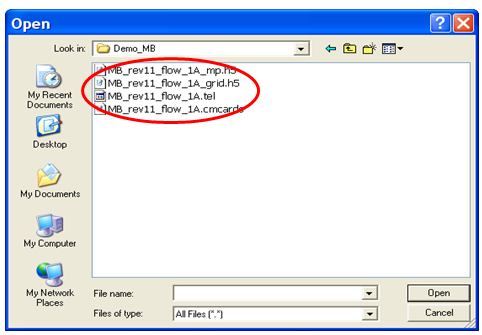
- 5. CMS-Flow setup: The CMS hydrodynamic input files for Matagorda Bay are required and prepared by the SMS shown in Figure 2-73.
Figure 2-73. Files for the CMS-Flow salinity simulation.
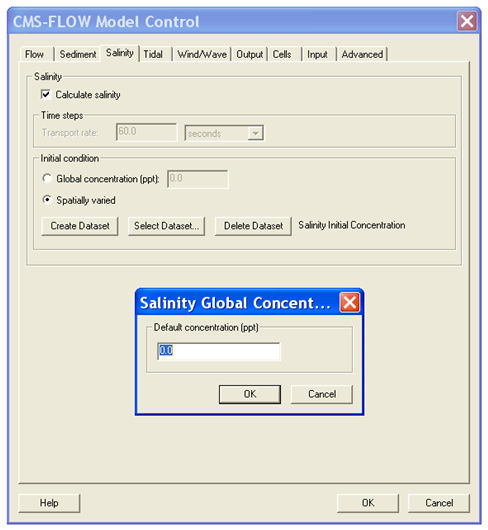
After opening “MB_rev11_flow_1A.cmcards” in the SMS, choose CMS-Flow | Model Control, click on Salinity, and select Calculate salinity (Figure 2-74). A default time step equal to the hydrodynamic time step has been specified. In this case, 900 sec is used for the salinity calculation.
- 6. Salinity initial condition: Because of the large spatial variability of salinity in a coastal system, it usually requires long spin-up periods for a salinity simulation to reach to the present salinity distribution, which could range from a few days to weeks. To shorten the spin-up time, an accurate initial condition for the salinity field should be specified. There are two options to assign the initial salinity condition in CMS-Flow:
- 7. A global initial salinity: Specify a constant initial value for the entire model domain. The salinity value can be specified by checking the Global concentration (ppt) under the Initial condition (Figure 2-74). If this option is applied, it is best to define an average representative salinity for the entire domain.
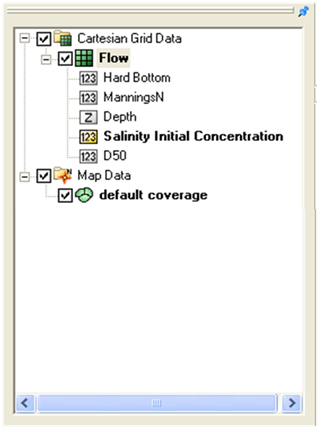
- 8. Spatially varying initial salinity: Generate a spatially varying initial salinity field by choosing the Spatially varied toggle under the Initial condition (Figure 2-74). Clicking the Create Dataset and assigning a value under the Default concentration (ppt) in the pop-up window will generate a new dataset with a constant initial salinity value. Clicking OK to close this window and then clicking OK, to close the CMS-FLOW Model Control window, will cause the dataset, Salinity Initial Concentration, to appear in the CMS-Flow data tree, as shown in Figure 2-75a. Highlight the dataset to specify different salinity values in the CMS domain in the same way to modify other datasets such as D50 or Hard Bottom.
Figure 2-74. Setting up the salinity calculation and specifying spatially varied initial salinity.
(a) (b)
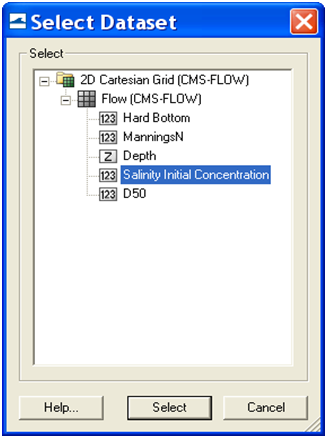
Figure 2-75. CMS-Flow data tree.
The dataset for a spatially varying initial salinity can also be generated by using the Data Calculator tool in the Data menu (Demirbilek et al. 2007). For an existing dataset, click the Select Dataset under the Spatially varied toggle and then select the dataset for the initial salinity that already exists (Figure 2-75b).
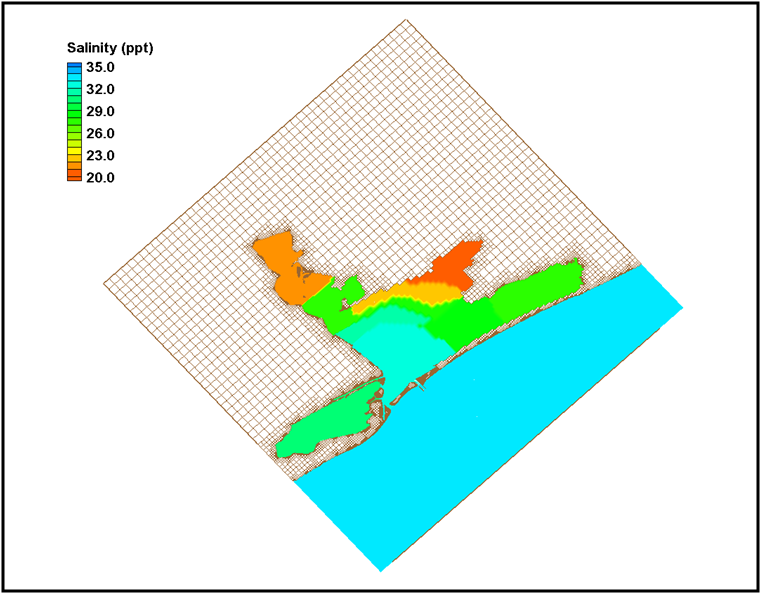
Based on the historical survey data, initial salinity is assigned in the dataset, Salinity Initial Concentration, for the Matagorda Bay system. The salinity varies from 21.0 ppt near the mouth of the Lavaca River to 33.0 ppt at the offshore open boundary (Figure 2-76).
Figure 2-76. Initial salinity distribution.
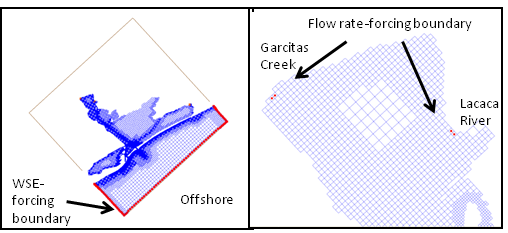
- 9. Salinity boundary conditions: To calculate salinity transport, salinity values at CMS-Flow boundaries need to be specified. Salinity may be specified at two boundary types in the CMS: water surface elevation (WSE) boundary (WSE-forcing boundary) (Figure 2-77a) and freshwater inflow boundary (Flow rate-forcing boundary) (Figure 2-77b).
- 10. WSE-forcing boundary: Using the Select Cellstring
 tool and clicking/ highlighting, the cellstring of water surface elevation boundary can be specified as shown in Figure 2 77a. Selecting CMS-Flow | Assign BC will open the CMS-Flow Boundary Conditions window (Figure 2-77). A time series of salinity can be assigned along the WSE-Forcing boundary by clicking the Curve undefined under Salinity on the left hand side of the dialog.
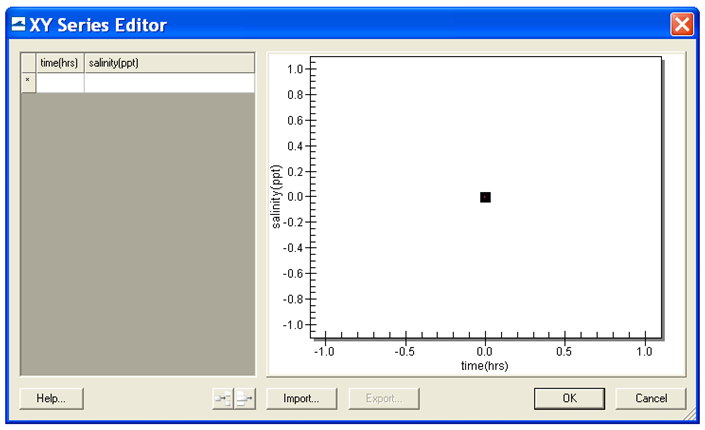
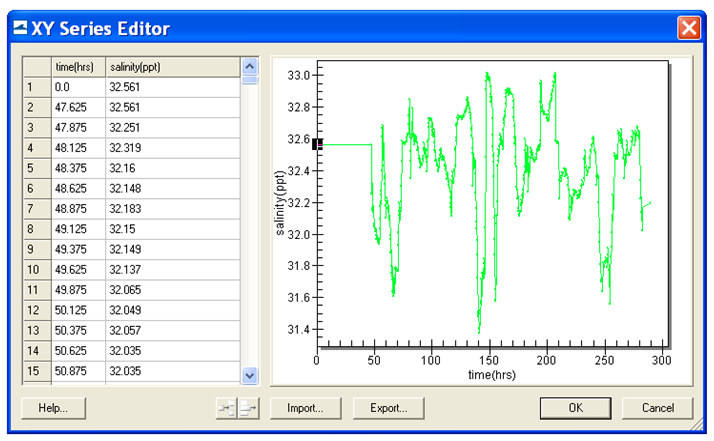
- 11. The time series is specified either by clicking the Import button to read a salinity boundary input file in xys format (Figure 2-78) (Aquaveo 2010), or by entering time and salinity values manually in two separate data columns, or by importing salinity data from an opened Excel file by using Copy/Paste.
Figure 2-77. Salinity boundary types in the CMS.
Figure 2-78. Salinity specifications along the WSE-forcing boundary.
Figure 2-79. Salinity boundary input from a xys file.
The salinity and water surface elevation measurements at Pass Cavallo and the NOAA Corpus Christi Gage were assigned to the offshore boundary. The 12-day time series of salinity data (November-December 2005) is shown for the WSE-forcing boundary in Figure 2 79. Salinity at this location varies between 31.5 and 33.0 ppt and shows apparent influence of the ocean during the period.
- 12. ii) Flow rate-forcing boundary: Following the same steps as specifying WSE-forcing boundary, salinity values at freshwater inflow boundaries can be assigned together with flow specifications.
- 13. The Colorado River, the Lavaca River, and the Garcitas Creek are fresh water sources that flow into Matagorda Bay and flow measurements are available at three USGS gages. A zero salinity value is assigned at the Flow rate-forcing boundaries.
The CMS’ capability in conducting the depth-averaged salinity calculation in Matagorda Bay was demonstrated. The CMS simulations represent the salinity transport in Matagorda Bay to a level useful for comparison be-tween engineering alternatives, and to understand the temporal variation and spatial distribution of salinity and the interaction between tides, freshwater inflows and meteorological conditions in the bay.
Sediment Transport
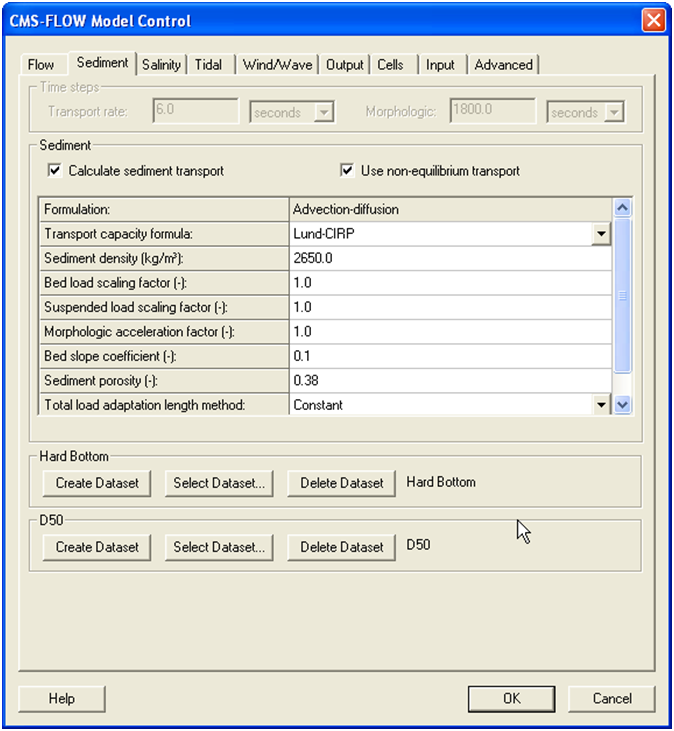
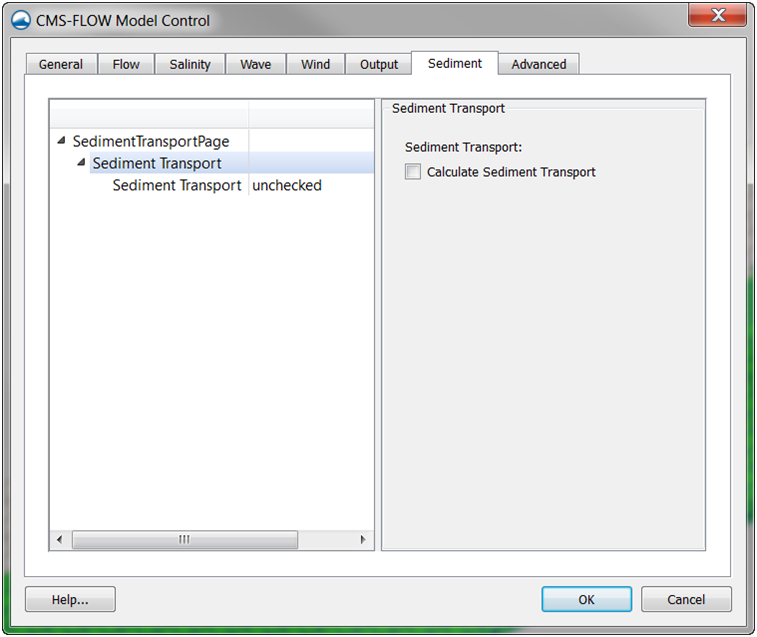
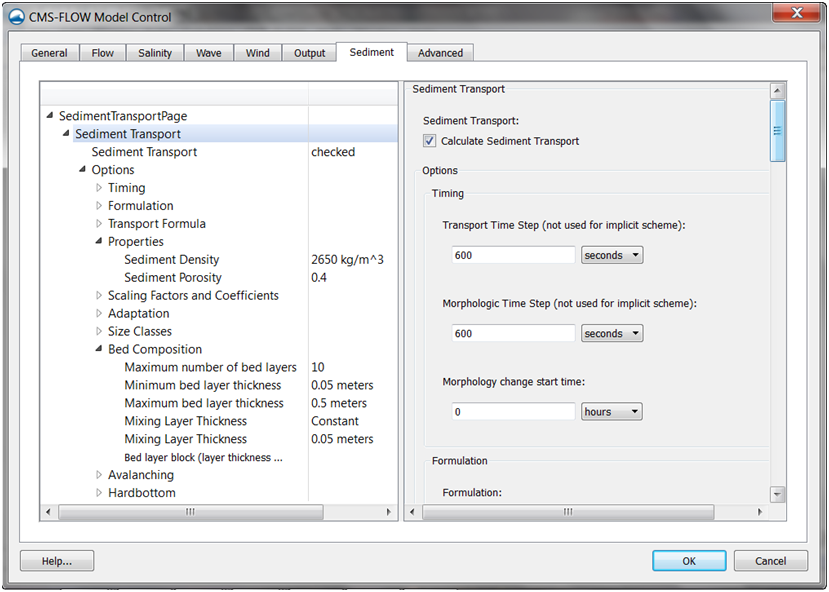
The sediment transport controls are located in the Sediment tab of the CMS-Flow Model Control window. The sediment tab for the SMS 11.0 and SMS 11.1 interfaces are shown in Figure 2-80 and Figure 2-81, respectively. The sediment transport is activated by going to the Transport section of the CMS-Flow Model Control and checking the box labels Calculate sediment transport. When the checkbox is unchecked, all of the sediment transport options become dimmed in SMS 11.0 or disappear in SMS 11.1. When the checkbox is checked the options become active or appear.
Figure 2-80. SMS 11.0 interfaces for sediment transport.
Figure 2-81. SMS 11.1 interfaces for sediment transport (sediment transport deactivated).
Figure 2-82. SMS 11.1 interfaces for sediment transport (sediment transport activated).
The CMS card used to turn on or off the sediment transport is described in Table 2-68.
Table 2-68. CMS card used to turn On or Off the sediment transport
| Input | Format | Notes |
|---|---|---|
| Sediment
Transport Activation |
[card=CALC_SEDIMENT_TRANSPORT]
[name=SedTrans, type=char, options=(ON,OFF), default=OFF] |
Turns on or off the sediment transport calculation. |
Timing
The sediment transport and morphologic time steps are the time steps at which the transport and bed change equations are calculated. For the ex-plicit model, these time steps can be several times that of the hydrodynamic model. Table 2-69 gives a description, default value, and range for the sediment transport and morphologic time steps. The option is available to not calculate the morphology change during the ramp period. The best practice is the start the model simulation so that the time when the ramp period ends corresponds to the time of the measured bathymetry. This avoids the initial bed erosion (although slight) of the bed. This also facilitates calculating simulation statistics such as transport rates and residual currents.
Table 2-69. CMS card used to set the sediment transport and morphologic time steps.
| Input | Format | Notes |
|---|---|---|
| Sediment
Transport Time Step |
[card=SED_TRAN_CALC_INTERVAL]
[name=SedTransdt, type=float, default=1.0, dependency=] [name=SedTransdtUnits, type=char, options=TimeUnits), default=’s’] |
Time step used for transport equation. See note 2 below. |
| Morphologic
Time Step |
[card=MORPH_UPDATE_INTERVAL]
[name=SedMorphdt, type=float, default=10.0, range=(>=0)] [name= SedTransdtUnits, type=char, options=TimeUnits), default=’s’] |
Time step used for updating bed elevation. See note 2 below. |
| Turns on the morphology
change during the ramp period |
[card=CALC_MORPH_DURING_RAMP]
[name=CalcMorphRamp, type=bool, default=15.0] |
Turns On or Off the morphology change calculation during the ramp period |
| Time to start the morphology change | [card=MORPH_START_TIME]
[name=MorphStartTime, type=float, default=0.0, range=(>=0)] [name= MorphStartTimeUnits, type=char, options=TimeUnits), default=’s’] |
Sets the starting time for the morphology change calculation. |
| Time to start the bed composition calculation | [card=BED_COMP_START_TIME]
[name=MorphStartTime, type=float, default=0.0, range=(>=0)] [name= MorphStartTimeUnits, type=char, options=TimeUnits), default=’s’] |
Sets the starting time for the bed composition calculation. |
Example 2-69. Specifying the sediment transport timing for the explicit temporal scheme.
SED_TRAN_CALC_INTERVAL 10.0 ‘sec’ !ONLY for explicit scheme MORPH_UPDATE_INTERVAL 10.0 ‘sec’ !ONLY for explicit scheme MORPH_START_TIME 120.0 ‘hrs !Recommend: longer than ramp
Example 2-70. Specifying the sediment transport timing for the implicit temporal scheme.
MORPH_START_TIME 120.0 ‘hrs !Recommend: longer than ramp BED_COMP_START_TIME 24.0 ‘hrs’ !ONLY available for implicit scheme
Notes:
- • For the explicit solver, the sediment transport and morphologic time steps should always be equal or a multiple of the hydrodynamic time step.
- • For the implicit solver, the sediment transport and morphologic time steps are always set to the hydrodynamic time. In SMS 11.0 the user is not allowed to change them for the implicit temporal scheme. However, in SMS 11.1 the user is allowed to set the sedi-ment transport time steps. It is important to remember that these time steps are not used when selecting the implicit temporal scheme.
- • When comparing measured and computed morphology change, it is recommended to start the simulation before the time of the initial measured bed change so that the end of the spin-up time matches the start time of the morphology change and the time of the initial bathymetry. The spin-up time is the time it takes for the hydrodynamics to reach a dynamic equilibrium and varies depending on the site. At a minimum the spin-up time should be equal to the ramp period.
Sediment Properties
The sediment properties are set in the Sediment tab of the CMS-Flow Model Control window. The sediment properties used in CMS are the density, porosity, fall velocity, and Corey shape factor. The sediment den-sity and porosity are constant and thus referred to as global sediment properties. The fall velocity is must be either specified or calculated for each size class and are therefore referred to as size class properties.
Global Sediment Properties
The global sediment properties are the sediment properties which are constant both spatially and temporally. Currently in CMS these properties are the sediment density and porosity. The sediment density depends on the mineralogy of the sediment. Most natural coastal sediments are composed of mostly quartz (SiO2) due to its abundance and it’s resistance to physical and chemical weathering. The density of quartz is approximately 2,650 kg/m3. This is why it is often assumed to be the density of natural sands. However natural beaches often contain other minerals such as lighter feldspar and heavier miners including hornblende, magnetite, and garnet. In tropical regions coastal sediments may contain large fractions of bioclastic carbonate material from corals and coralline algae. In addition, some beaches contain large fractions of shell fragments which have a lower density of about 2,400 kg/m3.
The sediment porosity is a function of the sorting and roundness of the bed material. Approximate porosity values can be obtained from Table 2-70. A sorting classification is described in Table 2-91.
Table 2-70. Porosity of natural sand beds (modified from Soulsby 1997).
| Packing | Well-sorted | Average | Poorly-sorted |
|---|---|---|---|
| Loosely packed | 0.46 | 0.43 | 0.38 |
| Average | 0.42 | 0.4 | 0.33 |
| Densely Packed | 0.4 | 0.37 | 0.3 |
Table 2-71 gives a description, default value, and range for the sediment properties.
Table 2-71. CMS-Flow card used for specifying the global sediment properties.
| Input | Format | Notes |
|---|---|---|
| Sediment
Porosity |
[card=SEDIMENT_POROSITY]
[name=SedPoro, type=float, default=0.4, range=(0.3>SedPoro<0.46)] |
Sets the sediment porosity |
| Sediment
Density |
[card=SEDIMENT_DENSITY]
[name=MorphStartTime, type=float, default=2650.0, range=(MorphStartTime>=0)] [name=SedDens, type=char, options=DensUnits), default=’kg/m^3’] |
Sets the sediment density in kg/m^3 |
Example 2-71. Specifying the global sediment properties.
SEDIMENT_DENSITY 2650.0 ‘kg/m^3’ !Units optional SEDIMENT_POROSITY 0.4 !Dimensionless
Notes:
- • The sediment density and porosity should NOT be used as calibra-tion parameters.
- • The sediment porosity and density are assumed constant for the whole domain and all grain size classes. For most coastal applica-tions these assumptions are reasonable but need to be taken into consideration.
Sediment Size Class Properties
The transported sediment material is discretized into different groups each representing the sediments within a specific size range. These groups are referred to as sediment size classes and have the following properties.
- 1. Characteristic diameter
- 2. Fall velocity
- 3. Corey shape factor
- 4. Critical shear stress
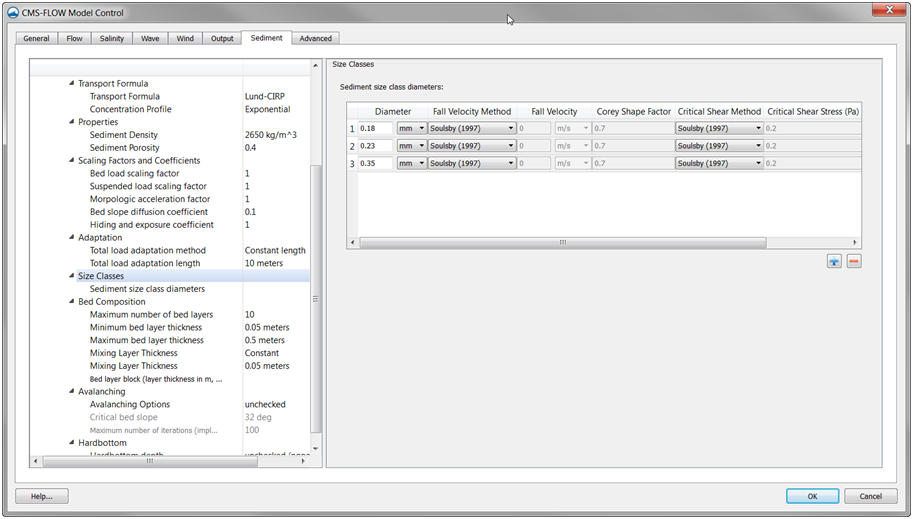
In SMS 11.1 the sediment size class properties are specified with the Size Class section within the Sediment tab of the CMS-Flow Model Control window (see figure below). Sediment size class classes can be added or removed using the ![]() and
and ![]() buttons, respectively. At least one sediment size class should be specified.
buttons, respectively. At least one sediment size class should be specified.
Figure 2-83. Sediment Size Class section within the Sediment tab of the CMS-Flow Model Control window in SMS 11.1.
Table 2-72. CMS-Flow card used for specifying the sediment size class block.
| Card | Format | Notes |
|---|---|---|
| Begins a
Sediment Size Class Block |
[begin=SEDIMENT_SIZE_CLASS_BEGIN,
name=SedClass, children=SedClass, CMS_version=(>4.10.00), SMS_version=(>11.1)] |
Begins the sediment size block |
| Sediment
Size Class Name |
[card=NAME, parent=SedClass,
SMS_version=none] [name=SedClassName, type=char] |
Specifies a sediment size class name. Optional. |
| Ends a
Sediment Size Class Block |
[end=SEDIMENT_SIZE_CLASS_END,
name=SedClass] |
Ends the sediment size class block |
Diameter
In the multiple-sized sediment transport model, the continuous grain sizes are divided into discrete bins or size classes. Each size class has a characteristic diameter, and lower and upper limits. The characteristic diameter is the diameter used in the sediment transport formula and to estimate other sediment size class properties if they are not specified. It is always required for all sediment size classes. The characteristic diameters dk is related to the bin lower dk-1/2 and upper dk+1/2 bin limits by
| (2-21) |
The CMS-Flow card used to specify the size class characteristic diameter is described in the table below.
Table 2-73. CMS-Flow card used for specifying the sediment size class diameter.
"Input| Format | Notes | |
|---|---|---|
| Sediment Size Class Characteristic
Diameter |
[card=DIAMETER, parent=SedClass]
[name=diam, type=float, default=none, range=(diam>0.06 ’mm’),required=true] [name=diamUnits, type=char, options=DistUnits), default=’mm’] |
Sediment size class characteristic diameter. |
