GenCade:Boundary Conditions: Difference between revisions
No edit summary |
No edit summary |
||
| Line 21: | Line 21: | ||
<math> Q^t_N+1 = Q^t_N - \frac{y_{RC} - (D_B + D_C)q^t_N}{2B} </math> | <math> Q^t_N+1 = Q^t_N - \frac{y_{RC} - (D_B + D_C)q^t_N}{2B} </math> | ||
where <math> B = \frac{\Delta t}{(2(D_B + D_C)\Delta x )} </math> and q is a line source/sink. | where <math> B = \frac{\Delta t}{(2(D_B + D_C)\Delta x )} </math> and ''q'' is a line source/sink. | ||
== Gated Boundary == | == Gated Boundary == | ||
Groins, jetties, shore-connected breakwaters, and headlands that | Groins, jetties, shore-connected breakwaters, and headlands that partially or completely interrupt the movement of sand alongshore may be incorporated as a boundary condition. If located on the internal domain of the grid, these objects will act to constrain the transport rate and shoreline change that is automatically calculated by GenCade. | ||
The effect of a groin, headland, or similar object located at the boundary is formulated in terms of the amount of sand that can bypass the structure. Consideration must be given to sand entering and leaving the model domain. For example, at a jetty located next to an inlet with a deeply dredged navigation channel, sand might move offshore of the jetty during times of high waves; in contrast, in the absence of shoals that might feed the beach, no sand is expected to | The effect of a groin, headland, or similar object located at the boundary is formulated in terms of the amount of sand that can bypass the structure. Consideration must be given to sand entering and leaving the model domain. For example, at a jetty located next to an inlet with a deeply dredged navigation channel, sand might move offshore of the jetty during times of high waves; in contrast, in the absence of shoals that might feed the beach, no sand is expected to bypass the navigation channel and jetty. The jetty/channel thus acts as a selective “gate,” allowing sand to move out of but not into the grid. | ||
As stated in [[GenCade:Structures in GenCade|Structures in GenCade]], bypassing around groins and jetties is controlled by the ratio <math> D_G/D_{LT} </math>, where <math> D_{LT} </math> (meters) is the depth out to which longshore sediment transport occurs and <math> D_G </math> (meters) is the depth at the seaward tip of the structure on the updrift side. This depth is, in turn, controlled by the distance from the structure tip to the shoreline. Also, to calculate transport at the groin/jetty location the shoreline orientation is needed, which depends on the shoreline locations on either sides of the structure. One problem with groins and jetties adjacent to inlets is that there is no shoreline on one side of the structure. For groins/jetties located on the lateral boundary, the shoreline location outside the grid is not known. Similarly, for jetties adjacent to inlets there is no shoreline on the inlet side of the structure. So, the user needs instead to specify a bypass coefficient that will control the sand flux around the structure. The bypass coefficient <math> BC </math> is defined as (Figure 2): | As stated in [[GenCade:Structures in GenCade|Structures in GenCade]], bypassing around groins and jetties is controlled by the ratio <math> D_G/D_{LT} </math>, where <math> D_{LT} </math> (meters) is the depth out to which longshore sediment transport occurs and <math> D_G </math> (meters) is the depth at the seaward tip of the structure on the updrift side. This depth is, in turn, controlled by the distance from the structure tip to the shoreline. Also, to calculate transport at the groin/jetty location the shoreline orientation is needed, which depends on the shoreline locations on either sides of the structure. One problem with groins and jetties adjacent to inlets is that there is no shoreline on one side of the structure. For groins/jetties located on the lateral boundary, the shoreline location outside the grid is not known. Similarly, for jetties adjacent to inlets there is no shoreline on the inlet side of the structure. So, the user needs instead to specify a bypass coefficient that will control the sand flux around the structure. The bypass coefficient <math> BC </math> is defined as (Figure 2): | ||
Revision as of 14:57, 7 February 2023
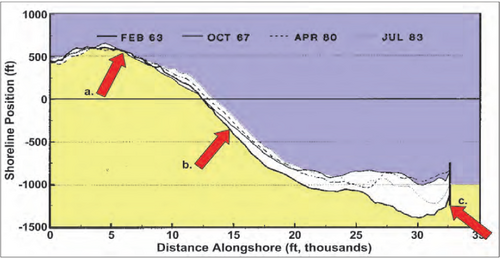
GenCade presently has three options for boundary conditions: pinned, moving, and gated. A boundary condition specified as pinned means that the boundary will not move from the initial shoreline position over the calculation interval. This is the default boundary condition. If a moving boundary condition is selected, the boundary will move a specified distance over a certain time period (specified by the user). The pinned and moving boundary conditions should be located sufficient distance from the area of interest to assure that the shoreline changes in the vicinity of the boundary do not affect changes in the project. A gated boundary condition is bounded with a groin. Figure 1 depicts shorelines at Anaheim Beach, CA, where (a) displays a pinned boundary condition, (b) represents the moving boundary because of the near-constant rate of accretion and (c) a gated boundary condition due to the presence of a groin/jetty.

Pinned Beach
It is helpful to review available measured shoreline position surveys to determine locations along a beach that might be used as model boundaries. In doing so, it is sometimes possible to find a portion of the beach distant from the project area that does not move appreciably in time, as shown in Figure 6. By locating the model boundary at such a location, the modeled lateral boundary shoreline can be said to be ‘pinned’. Expressed in terms of the transport rate, this means:
or
depending on which end of the grid is considered. These relations can be readily understood by reference to the original governing equation (see Governing Equations); if the Q differential with respect to x is zero at the boundary, then the y differential with respect to t is also zero, meaning y does not change over time.
Moving Beach
If a section of beach cannot be found to be represented by the pinned beach boundary condition, it might be possible to locate a section where the shoreline is moving with a constant rate of change . In such a case, the boundary condition can be expressed as:
where the superscripts denote the relative time. In GenCade, the boundary condition is expressed in terms of transport rates. Again, with reference to the initial governing equation, the boundary condition may be formulated as:
where and q is a line source/sink.
Gated Boundary
Groins, jetties, shore-connected breakwaters, and headlands that partially or completely interrupt the movement of sand alongshore may be incorporated as a boundary condition. If located on the internal domain of the grid, these objects will act to constrain the transport rate and shoreline change that is automatically calculated by GenCade.
The effect of a groin, headland, or similar object located at the boundary is formulated in terms of the amount of sand that can bypass the structure. Consideration must be given to sand entering and leaving the model domain. For example, at a jetty located next to an inlet with a deeply dredged navigation channel, sand might move offshore of the jetty during times of high waves; in contrast, in the absence of shoals that might feed the beach, no sand is expected to bypass the navigation channel and jetty. The jetty/channel thus acts as a selective “gate,” allowing sand to move out of but not into the grid.
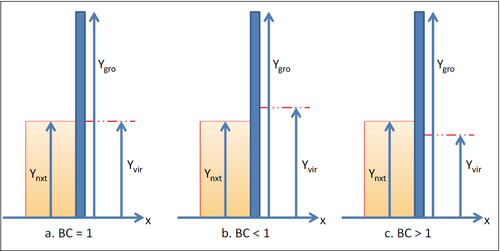
As stated in Structures in GenCade, bypassing around groins and jetties is controlled by the ratio , where (meters) is the depth out to which longshore sediment transport occurs and (meters) is the depth at the seaward tip of the structure on the updrift side. This depth is, in turn, controlled by the distance from the structure tip to the shoreline. Also, to calculate transport at the groin/jetty location the shoreline orientation is needed, which depends on the shoreline locations on either sides of the structure. One problem with groins and jetties adjacent to inlets is that there is no shoreline on one side of the structure. For groins/jetties located on the lateral boundary, the shoreline location outside the grid is not known. Similarly, for jetties adjacent to inlets there is no shoreline on the inlet side of the structure. So, the user needs instead to specify a bypass coefficient that will control the sand flux around the structure. The bypass coefficient is defined as (Figure 2):
where is the length of the groin, is the virtual shoreline location (inside the inlet channel or just off the model grid), and is the shoreline location just next to the structure. The default of the bypass coefficient is 1, but may be manually set to any value greater or equal to zero. If it is set to less than 1, less sediment will go into the inlet channel (if next to an inlet) or out of the model area (if next to the model boundary). In both situations the accumulation against the structure () will increase. For BC greater than 1, the opposite will happen. Thus, a constructive strategy could be to start with the default value BC = 1 and then increase or decrease BC depending on whether more or less accumulation is desired against the structure.


